Kubernetes Basics + Advanced


0# Why Kubernetes?
Cluster
Auto-healing
Auto-scaling
Multiple enterprises support.
Note: Docker does not have this support.
Control plane (master node):
API server: It exposes basically Kubernetes to the other world. It takes all the requests from external worlds.
etcd: It is basically a key value store. The entire Kubernetes cluster information is stored as objects that are key-value pairs inside this, etcd.
Scheduler: responsible for scheduling the pods or scheduling the resources of Kubernetes. It is receiving the information from an API server.
Controller manager: This controls the replica set. Manage the Kubernetes in-build controller.
Example: replica set
Cloud controller manager (CCM): This is an open-source utility. If you have on-premises service, then this component is not required.
Data plane (worker node):
Kubelet: responsible for maintaining, creating, or running a pod. If pods are not running, then they will take the necessary actions using the Kubernetes control plane.
Kube-Proxy: Provide networking, like generating the IP address or load-balancing. Basically, it uses IP tables on your Linux machine. When we want to use auto-scaling, then this service will create a network between pods.
Container runtime: responsible for running a container.
Pod
A pod is like a wrapper for a container. It works like a Docker container. Inside the pod, there will be a container. A pod can be a single container or a group of containers. In most cases, a pod has a single container. If you put a group of containers in a pod, then there will be some advantages. You can get access to the container application through the pod cluster IP (kube-proxy generates the cluster IP address.).
- Kubernetes will allow you to do shared networking, share files, and share storage. Inside a single pod container, pods can talk to each other by using localhost.
YAML file written for pods.
All Kubernetes Commands:https://kubernetes.io/de/docs/reference/kubectl/cheatsheet/
apiVersion: v1
kind: Pod
metadata:
  name: nginx
spec:
  containers:
  - name: nginx
    image: nginx:1.14.2
    ports:
    - containerPort: 80
kubectl create -f pod.yml
kubectl get pods
kubectl get pods -w    # To see live execution of pods.
kubectl get all
kubectl get all -A
kubectl get pods -o wide
minikube ssh          # login to your minikube kubernetes cluster.
docker@minikube:~$ curl 10.244.0.3
kubectl logs "pods-name"              # Important for interview
kubectl describe pod "pod-name"        # Important for interview
To get these two services, we need to use a wrapper deployment.yml from Kubernetes.
Container: Docker, used commands (docker run....) .
Pod: yaml manifest (running specifications) - single or multiple containers .
Deployment: Auto-healing and auto-scaling capabilities; roll-out the replicas -pods.
Replica set: Kubernetes Controller, and it is for auto-healing pods.
kubectl get pods --namespace=kube-system
kubectl create namespace <name>
kubectl get namespaces
kubectl apply -f <file name>
kubectl get pods --namespace= <name>
kubectl get po --namespace=<name> -o wide
kubectl delete -f <.yaml>
kubectl apply -f deployment.yaml
kubectl delete pods <pods_name>
kubectl get pods -o wide -n <namesapaces>
kubectl get svc -n <shawon>
minikube service my-service -n shawon --url
curl -L http://192.168.49.2:32469
minikube service my-srvice -n shawon
wget <link>
#wget https://bin.equinox.io/c/bNyj1mQVY4c/ngrok-v3-stable-linux-amd64.tgz
tar -xvzf <file>
#example:
#tar -xvzf ngrok-v3-stable-linux-amd64.tgz
./ngrok http 192.168.49.2:32068
ngrok http 192.168.49.2:32068
kubectl apply -f ingress.yaml
sudo vim /etc/hosts
curl -L 192.168.49.2

minikube pause
minikube unpause
minikube stop
minikube config set memory 9001
minikube addons list
minikube start -p aged --kubernetes-version=v1.16.1
minikube delete --all
Auto-scaling and auto-healing
Deployment
Resources:https://kubernetes.io/docs/concepts/workloads/controllers/deployment/
Deployment is responsible for implementing auto-healing and zero downtime in Kubernetes. Deployment is done with the help of a replica set, which is done by the Kubernetes controller.
kubectl get deploy
kubectl get rs    # Replica set.
kubectl get pod
kubectl get pods -w    # To see live pods status.
Services
It acts as a load-balancer. It uses the Kubernetes component Qube-proxy. The service will track IP addresses as well as labels and selectors.
payment.defaulf.svc
Load-Balancer
service Discovery ( using labels and selectors)
Expose the application to the outside of the cluster.
a) Cluster IP- If you use this cluster IP service mode, then you will get discovery and load balancing. Get access from inside the cluster.
b) Node Port- It will allow your applications to be accessed inside your organization (on the same network). If you have EC2 instance IP or VPC traffic access, then you will have access to the pods.
c)Load Balancer- This service will expose your application to the external world (private IP address). It will work only on cloud-based K8s (EKS, AKE), and it works through the cloud controller manager. For locally (minikube, kubeadm, and so on), it will not work; in this case, we will use an ingress controller.
Some Interview questions
What is the difference between Docker and Kubernetes?
Ans: Docker is a container platform, where as Kubenetes is a container orchestration environment that offers capabilities like auto-healing, auto-scaling, clustering, and enterprise-level support like load balancing.
What are the main components of Kubernetes architecture?
Ans: On a broad level, you can divide the Kubernetes components into two partes:
a) Control Plane (API Server, Schduler, Controller Manager, C-CM,etcd)
b) Data Plane (Kubelet, Kube-proxy, Container Runtime)
What are the main differences between the Docker Swarm and Kubernetes?
Ans: Kubernetes is better suited for large organizations as it offers more scalability, networking capabilities like policies, and huge third-party ecosystem support.
What is the difference between a Docker container and a Kubernetes pod?
Ans: A pod in Kubernetes is the runtime specification of a container in Docker. A pod provides a more declarative way of defining using YAML, and you can run more than one container in a pod.
What is a namespace in Kubernetes?
Ans: In Kubernetes, namespace is a logical isolation of resources, network policies, rbac and everything. For example, there are two projects using the same k8s cluster. One project can use ns1 and other project can use ns2 without any overlap or authentication problems.
What is the role of kube proxy?
Ans: Kube-proxy works by maintaining a set of network rules on each node in the cluster, which are updated dynamically as services are added or removed. When a client sends a request to a service, the request is intercepted by Kube-proxy on the node where it was received. Kube-proxy then looks up the destination endpoint for the service and routes the request accordingly.
Kube-proxy is an essential component of a Kubernetes cluster, as it ensures that services can communicate with each other.
What are the different types of services within Kubernetes?
Ans: 1. Cluster IP Mode . 2. Nord Port Mode. 3. Load Balancer Mode.
What is the difference between NodePort and LoadBalancer-type services?
Ans:
When a service is created with a NordPort type, the Kube-proxy updates the IP tables with the node IP address and port that are chosen in the service configuration to access the pods.
If you create a service of type LoadBalancer, the cloud control manager will create an external load balancer IP using the underlying cloud provider logic in the C-CM. Users can access services using the external IP.
What is the role of Kubelet?
Ans: Kubelet manages the containers that are scheduled to run on that node. It ensures that the containers are running and healthy and that the resources they need are available.
Kubelet communicates with the Kubernetes API server to get information about the containers that should be running on the node, and then starts and stops the containers as needed to maintain the desired state. It also monitors the containers to ensure that they are running correctly and restarts them if necessary.
Day-to-day activities on Kubernetes?
Ans:
Install Tools
Set up Kubernetes tools on your computer.
-
Learn common tasks for administering a cluster.
-
Perform common configuration tasks for Pods and containers.
Monitoring, Logging, and Debugging
Set up monitoring and logging to troubleshoot a cluster, or debug a containerized application.
-
Declarative and imperative paradigms for interacting with the Kubernetes API.
-
Managing confidential settings data using Secrets.
-
Specify configuration and other data for the Pods that run your workload.
-
Run and manage both stateless and stateful applications.
-
Run Jobs using parallel processing.
Access Applications in a Cluster
Configure load balancing, port forwarding, or setup firewall or DNS configurations to access applications in a cluster.
-
Understand advanced ways to adapt your Kubernetes cluster to the needs of your work environment.
-
Understand how to protect traffic within your cluster using Transport Layer Security (TLS).
-
Perform common tasks for managing a DaemonSet, such as performing a rolling update.
-
Learn how to configure networking for your cluster.
-
Extend kubectl by creating and installing kubectl plugins.
-
Configure and manage huge pages as a schedulable resource in a cluster.
-
Configure and schedule GPUs for use as a resource by nodes in a cluster.
Note: Service will look at the labels because service works on the concept of labels and selectors.
kubectl get pods -v=7    # to see behind the running function of Kubernetes
# when your run th ekubectl get pods command.
apiVersion: apps/v1
kind: Deployment
metadata:
  name: sample-python-app
  labels:
    app: sample-python-app
spec:
  replicas: 2
  selector:
    matchLabels:
      app: sample-python-app
  template:
    metadata:
      labels:
        app: sample-python-app
    spec:
      containers:
      - name: python-app
        image: abhishekf5/python-sample-app-demo:v1
        ports:
        - containerPort: 8000
Services
Whenever a replica is set, make a new pod, and the pod's IP address changes because Kubernetes does a dynamic allocation of IP addresses; it's not a static allocation. If there was a static allocation, then a new pod would come up every time with the same IP address. So this is the reason why we need a service discovery mechanism.
If Kubenetes Services was identifying the pods using the IP address, then it would be wrong. It will face traffic loss because the IP address has changed. In this case, using labels and selectors Kubernetes service identifies the pods using the labels and selectors concepts So, every time a new pod comes up, its label will remain the same. A label is like a stamp or tag. Every time a pod comes up with the same tag IP address might change, but the tag, the stamp, or the label is always the same.
NodePort Service
apiVersion: v1
kind: Service
metadata:
name: python-django-app-service
spec:
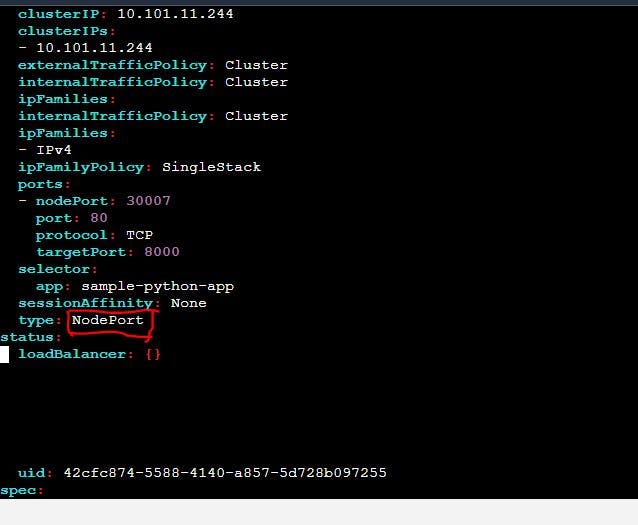
type: NodePort
selector:
app: sample-python-app
ports:
- port: 80
# By default and for convenience, the `targetPort` is set to
# the same value as the `port` field.
targetPort: 8000
# Optional field
# By default and for convenience, the Kubernetes control plane
# will allocate a port from a range (default: 30000-32767)
nodePort: 30007
kubectl get svc
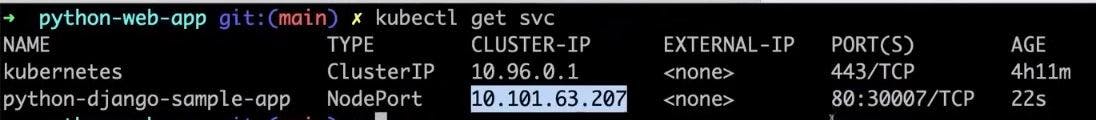
We can see the application is running. 10.101.63.207 is cluster IP, and we used the NodePort service, and we can see port mapping is done: 80:30007/TCP
Without going to cluster, we will have access to our application.
ubuntu@ip-172-31-83-8: curl -L http://"ec2_IP":30007
# used NodePort: We have access the application inside the same network.
# Now we have access the pod from outside of the cluster.
# We don't need to go cluster: minikube ssh
# Outside of our network it is not possible to get access of the applications.
ubuntu@ip-172-31-83-8: curl -L http://18.208.137.197:30007/demo
Now we want to get access from outside of the network. It comes from the internet. For this, we need to edit the service file:
kubectl get svc
kubectl edit svc "service_name"
kubectl edit svc python-django-app-service # this is my service.
Change the type of service. Write LoadBalancer. It will not work here because we are using Minikube. If we use the cloud-based platform of Kubernetes, then it will work.

See Type is LoadBalancer, and external IP is pending because of using Minikube.(Metalib can solve this issue in Minikube) If we use AWS Azure or GCP, then we will see the external IP address. and cloud controller manager of Kubernetes doing this work.
LoadBalancer
We will use Kubeshark.
Link: https://docs.kubeshark.co/en/install
Link: https://dev.to/thenjdevopsguy/kubeshark-the-wireshark-for-kubernetes-3a72
First, install kubeshark properly
 sh <(curl -Ls https://kubeshark.co/install)
 kubeshark tap -A   # For all namespaces
 kubeshark tap      # For single namespaces
 kubeshark clean
 curl -L http://192.168.49.2:30007/demo   # 192.168.49.2 is my minikube ip
To get access of Kubeshark, run localhost:8899
LoadBalancing: NGINX or F5 or ambasador or Traefik or HA proxy
Enterprise level LoadBalancing :
Ratio based loadbalancer : 3 request for pod number 1 and 7 request for pod number 2.
sticky session LoadBalancing: If one request is going to pod number 1 then all the request of the specific user have to go to pod 1 only.
Path based LoadBalancing:
Domain and Host based LoadBalancing:
White Listing: They can only allow specific customers to access the application.
They can do Balack Listing: So that any hacker do not allow from anywhere. So, You can define your traffic.
Problem of LoadBalacer:
Enterprise & TLS loadbalancer (Sticky, TLS, path, Ratiobased) is missing in service load balancing.
If you use a service like loadbalancer > cloud provider will charge you for every IP (static public IP address) .
Ingress
For example you have a Kubernetes Cluster and a pod (yml manifest file). Kubelet will deploy the pod.
Let say you are creating a service.yml and there is a kube proxy. and it will update the ip table rules.
Let say you are creating ingress So, there has to a resource or component or a controller which has to watch for this ingress. So this is the problem. Kubernetes said that okay I can create ingress resource but if i have to implement logic for all the load balancers that are available in the market that is nginx, F5 , traffic, ambassador etc So, Kuberntes said that okay it is technically impossible I can not do it. So what i will do is I will come up with the architecture and the architecture is User will create ingress resource , Load balancing companies (NGINX, F5,traffic and so on) they will write their own ingress controllers and they will place these ingress controllers on GitHub and they will provide the steps on how to install this ingress controllers using Helm Charts or any other ways and as a user instead of just creating ingress resource you also have to deploy ingress controller. So, It is up to the organization to choose which ingress controller they want to use what is ingress controller end of the day it is LoadBalancer + some API gateway.
First , deploy a ingress controller, like NGINX (Go to the NGINX GitHub repository) After that you will create ingress resources depending upon the capabilities you need. If you need Path based routing, then you will create one type of ingress, or if you need TLS based ingress you will create another typer of Ingress.
Ingress does not have one-to-one mapping , you can create one Ingress and you can handle 100 services as well using paths you can say path is A go to service one , if path is B go to service two.
Enterprise Level: Security, Good quality of loadbalancing.
Ingress setup
We will set ups host based ingress services.
Link: https://kubernetes.io/docs/concepts/services-networking/ingress/
Go to this official page and see ingress controller with host based.
apiVersion: networking.k8s.io/v1
kind: Ingress
metadata:
  name: ingress-example
spec:
  rules:
  - host: "foo.bar.com"
    http:
      paths:
      - pathType: Prefix
        path: "/bar"
        backend:
          service:
            name: python-django-app-service
            port:
              number: 80
Change the service name according to your service name and now apply this ingress service.
kubectl apply -f ingress.yml
kubectl get ingress
# NAME              CLASS    HOSTS         ADDRESS   PORTS   AGE
# ingress-example   <none>   foo.bar.com             80      9s
# We can see our ingress is applied but without address.
# If we now run curl command it will not work.
curl -L http://foo.bar.com/bar -v
# Because we didn't create Ingress Controller.
Ingress Controller:
Install Ingress controller
There are so many ingress controller are available in market. One of the most popular is NGINx, So we will use NGINX ingress controller.
Link: https://kubernetes.io/docs/tasks/access-application-cluster/ingress-minikube/
minikube addons enable ingress
This is for minikube. In production level, minikube will not use. So for production level ingress controller (ambassador) go to the link: https://www.getambassador.io/docs/emissary/latest/tutorials/getting-started
To check NGINX controller installed or not. It self a pod.
kubectl get pods -A | grep nginx
kubectl logs ingress-nginx-controller-7c6974c4d8-lsn8j -n ingress-nginx
So we will see ingress controller is scheduled. Once it done it will go to the nginx loadbalancer that is nginx.conf file.
kubectl get ingress
# NAME              CLASS    HOSTS         ADDRESS        PORTS   AGE
# ingress-example   <none>   foo.bar.com   192.168.49.2   80      96m
Now we can see address is update now because of install nginx ingress controller. This enough for production level. But If you want to do it in your local server then you have to update the /etc/hosts
sudo nano /etc/hosts
# add 192.168.49.2 foo.bar.com
ping foo.bar.com
# It will ping. Sometimes it will not work.
curl -L http://foo.bar.com/bar -v
For production level they use https service.
ConfigMaps & Secrets
ConfigMap: A ConfigMap is an API object used to store non-confidential data in key-value pairs. Podscan consume ConfigMaps as environment variables, command-line arguments, or as configuration files in a volume.
A ConfigMap allows you to decouple environment-specific configuration from your container images, so that your applications are easily portable.
Create a config map inside the Kubernetes Cluster and put the information like DB port or DB environmental variable inside the configMap. You can mount this configMap or you can use the details of the configMap inside your Kubernetes pod.So the information can be stored inside your pod as a environment variable or can be stored as a file inside your pod on your container file system but this information has to be retrieved from the configMap because as a user you can not login to the pod, you can not go to the container and once you go to the container you can not create this environment variable. As a DevOps Engineer ypu can collect this information that a user requires you can talk to the database admin and you can create a configMap and inside the configMap you can store these values once you store these values you can mount this config map or you can use this configMap as the data of this configMap as environment variables inside your kubernetes pod.
Environment variable
Mount the volume
So, configMap solving the problem of storing the information that can be used by your application later point of time. So config Map is used to store data and this data can be later point of time used by your application or your pod or your deployment.
If configMap solve this problem then why you need secret in kubernetes?
*Secrets in Kubernetes solves the same problem but secrets deal with sensitive data that means to say you store DB user name or password.
Kubernetes says is if you put any kind of data inside of the secret what we will do is we will encrypt the data at the rest that means to say before the object is saved in etcd kubernetes will encrypt this one. By default Kubernetes uses a basic encryption but what kubernetes says is we will also allow you to use your own encryption mechanism like the custom encryption. So, you can pass these values to their API server and say that whenever you are storing like you know API server is feeding some information to the etcd you can use this custom encryption and even if hacker is trying to access this etcd because he does not know the decryption key. He can read all the information from etcd.
kubectl get cm #To get ConfigMap
Now create ConfigMap
apiVersion: v1
kind: ConfigMap
metadata:
    name: test-cm
data:
    db-port: "3306"      #MySQL port is 3306
kubectl apply -f cm.yml
kubectl get cm
kubectl describe cm test-cm

Here we can see data entry save in our ConfigMap. Similarly you can save any number of data. As part of your application in your Enterprise application might require a lot of fields then you can use a lot of fields here. Later you can points this fields as environment variable inside your kubernetes pods that is what we are going to see now.
So my end goal now will be to take this field from the config Map and to put this fields as environment variable inside my Kubernetes pod but for that firstly I have to create a Kubernetes pod itself.
Apply deployment.yml file
How do i look into the environment variables of this pods, you can run the command.
kubectl exec -it "name_of_the_pod" -- /bin/bash   #To go inside the pod.
kubectl exec -it sample-python-app-5894dd7f76-h7chp -- /bin/bash
root@sample-python-app-5894dd7f76-h7chp:/app# env | grep db
root@sample-python-app-5894dd7f76-h7chp:/app#
See we don't have any environment variable here with respect of db because this is just an application running now till now it does not have information of the database like it does not have the information of database port.
Let's say I am using MySQL database in this application and I want use the information that is I want to know the database Port of MySQL So, What I have to do is I have to modify deployment.yml file with adding env because I want to read value as an environment variable.
        env:
         - name: DB-PORT
           valueFrom:
            configMapKeyRef:
             name: test-cm
             key: db-port
apiVersion: apps/v1
kind: Deployment
metadata:
  name: sample-python-app
  labels:
    app: sample-python-app
spec:
  replicas: 2
  selector:
    matchLabels:
      app: sample-python-app
  template:
    metadata:
      labels:
        app: sample-python-app
    spec:
      containers:
      - name: python-app
        image: abhishekf5/python-sample-app-demo:v1
        env:
         - name: DB-PORT
           valueFrom:
            configMapKeyRef:
             name: test-cm
             key: db-port
        ports:
        - containerPort: 8000
Once we apply deployment and go to inside the pods we will find DB

Now the developer what can do inside is java application he can just say that os.env("DB-PORT") he can retrieve the value for his data base connection.
So this is how you use ConfigMap you use inside a application as environment variable but now there is a problem...
The problem is let's say I am the devOps engineer and I realize that for some reason I want to change the DB port now I do i change this?
Lets change config map port number instead of 3306 to 3306 . but how will the pod come to know about this change okay so if I just do kubectl exec again we will go to the same pod one more time if you see the DB port is still 3306. So your application will continue with 3306 and it will fail because the port has changed.
To solve this problem what kubernetes has said if you have this kind of information if you have the information that keep changing okay the changing the environment variables inside kubernetes is not possible. inside containers is also not possible , because you can never update a value like today you can go to any container and try to update the environment variable value.
Container does not allow to changing the environment variable you have to recreate the container but in production you can not restart the container beacuse it might lead to some traffic loss.
In this case Kubernetes said that use volume mounts. using the volume mounts you can do same thing but instead of using them as environment variables you will use them as files because you are mounting. So your configmap information will be saved inside a file and developers can read the information from the file instead of environment variable. Let's see how it will work.
Now edit deployment.yml file. Delete env block and add a volume mount.
apiVersion: apps/v1
kind: Deployment
metadata:
  name: sample-python-app
  labels:
    app: sample-python-app
spec:
  replicas: 2
  selector:
    matchLabels:
      app: sample-python-app
  template:
    metadata:
      labels:
        app: sample-python-app
    spec:
      containers:
      - name: python-app
        image: abhishekf5/python-sample-app-demo:v1
        volumeMounts:
         - name: db-connection
           mountPath: /opt
        ports:
        - containerPort: 8000
      volumes:
        - name: db-connection
          configMap:
            name: test-cm
In kubernetes you can create internal volume or external volume, persistence volume, configMap. In this case I am created a volume that reads the information from config map. Volume is nothing but a storage, It's just a block and inside that - read the information from config map so this is like a Docker volume.
ubuntu@ip-172-31-83-8:~python-web-app$ kubectl exec -it sample-python-app-6c5b459cc9-5d7gw -- /bin/bash
root@sample-python-app-6c5b459cc9-5d7gw:/app# env | grep DB
root@sample-python-app-6c5b459cc9-5d7gw:/app# ls /opt
db-port
root@sample-python-app-6c5b459cc9-5d7gw:/app# cat /opt/db-port | more
3306
So, this is mounted inside the what is it the file system. now again edit configMap
vim cm.yml         # Change the port instead of 3306 to 3307.
kubectl apply -f cm.yml
kubectl describe cm test-cm
Once we did it we will see port number is changed 3306 to 3307. It happend in our configmap file.
Now time see inside the pod that port is changed or not. For that run command:
ntu@ip-172-31-83-8:~python-web-app$ kubectl exec -it sample-python-app-6c5b459cc9-5d7gw -- /bin/bash

root@sample-python-app-6c5b459cc9-5d7gw:/app# cat /opt/db-port | more
3307
Perfectly changed the DB port. We see the changed by a single command.
kubectl exec -it sample-python-app-6984b4f58 -- cat /opt/db-port
Secret file will also work like this. There are many types of secret are used. Like TLs(for store certificates), generic (for username and password)
Let's create a secret file:
# To create a secret.
kubectl create secret generic test-secret --from-literal=db-port="3306"
# or
vim secret.yml

kubectl describe secret 'secret-name'
#In my case: kubectl describe secret test-secret
If we see secret file we will see the eneryptions.
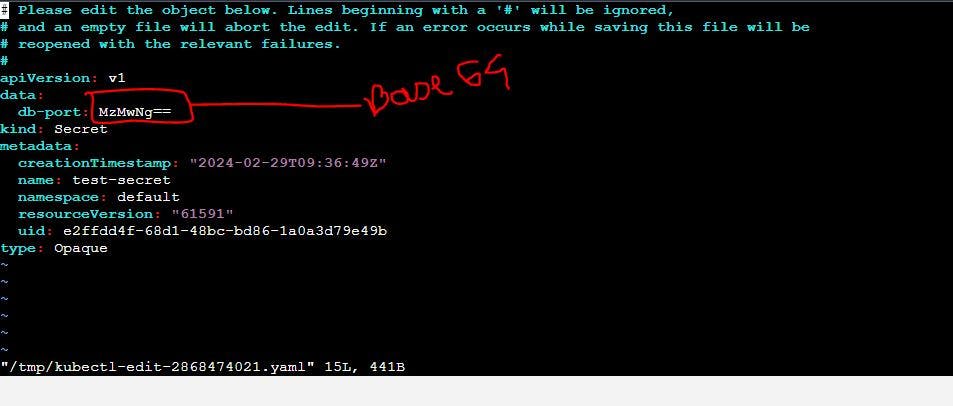
kubectl edit secret test-secret
In secret file Kubernetes does encrypt in Base64 . But this is not a great encryption by default Kubernetes doesn't support great encryption. You can encrypt your own way.
For encryption here you can use something like a hasicorp vault or use seal secrets or differen things. For encrypting the secrets on your Kubernetes namespace level or during your kubernetes secret creation but at the rest using etcd you have to pass it to the API server whatever you are encrytion keys but here your Kubernetes secret got saved.
If want decode your secret key.
echo MzMwNg== | base64 --decode
To read more about secret. visit kubernetes documentations.
Kubernetes RBAC ( Role Based Access Control)
Kubernetes RBAC broadly divided into two parts. First part is USER and second part is SERVICE ACCOUNTS(manage access in the Kubernetes) .
USER:
If you have a Kubernetes Cluster , Lets say you have been using Kubernetes by using Minikube or kind or any other Kubernetes platform. So, out of the box you get administrative access to these cluster because they are your local Kubernetes clusters and you have been playing around with this local K8s cluster for learning purposes. In organizations level the very first thing that you would do define access to K8s cluster. But your K8s cluster access would be given to other team or person and in this case if they some delete anything then it is difficult to get original states back. In this case RBAC can help.
RBAC depending upon the role of the person.
SERVICE ACCOUNTS:
Let's say you have created a pod now what access does this port need to have on the Kubernetes Cluster so should pod be having access to configMaps or secrets.
Lets say you have a pod and this is malicious pod and what this pod is doing is it is deleting some content related to API server or accidentally it is removing some important files on your system so how do you restrict this, so again the same thing similar to USER management . you can also manage the access for your services or for your applications that are running on the cluster using the RBAC, so two primary responsibilities of RBAC is USER management as well as managing the access of the services that are running on the cluster.
Three major things for managing RBAC
Service Accounts or USERS
K8s Roles / Cluster Roles
Role binding / Cluster Role binding
Kubernetes does not deal with USER management whereas kubernetes offloads the user management to identity providers.
IDENTITY PROVIDERS: Lets say you are using any applications the fundamental thing that you might have noticed is most of these applications have options like login with instagram or popular one is login with google and what happens is you dont have to create account with this applications lets say there is a person who has downloaded an application from play store and you know most of the times you get this option called login with google and what happens is this person gets access to this app without creating the user this is what exactly kubernetes also does so, Kubernetes says is I will offload the user managements. So, in kubernetes you all know that there is a component called API server so you can pass certain flags to the API server.
So, you can offload the user management to any identity providers like you are using EKS why can't you use IAM users that what kubernetes says. For this you need to create IAM provider or IAM auth provider.
And using this IAM the person will login to the k8s cluster and already you have created users and groups in IAM So if you have a user and if you have I mean if your user and if you have I mean if your user belongs to a group so as you log into the kubernetes so you get to login with same username and you get to log in with the same group. So this is how kk8s offloads the user management to external identity providers. This concept is same whether it is openshift whether it is EKS or AKS.
you can use identity brokers like Key clock. It is very popular one.
Service accounts is just a yml file. everyone can create this.
Lets say you log in as a user or your application is currently running as a service account by default if you are creating a pod. Kubernetes will create default service account. Kubernetes will attach the default service account to your pods if you are creating a service account then you can use your custom service amount but what happens after that, whether you are logged in into your kubernetes cluster as a user or whether your application is running on a kubernetes as a service account. afterthat how do you mange the rules or how do you mange the configurations.
So, define access after this part K8s supports two important resources that is called Role and Role Binding.
Once your application is running as a service account or you logged in as a user the next part is how to grant access to it. So firstly you will create a role (lets say for developer you are creating the role: In role you are saying is they have access to pods, ConfigMaps. secrets in the same namespaces. Now you have to attach this role to the user. So, To attach you will use rolebinding.
Role is yml file where you will write all the things like they need to have access to config map, secrets,.
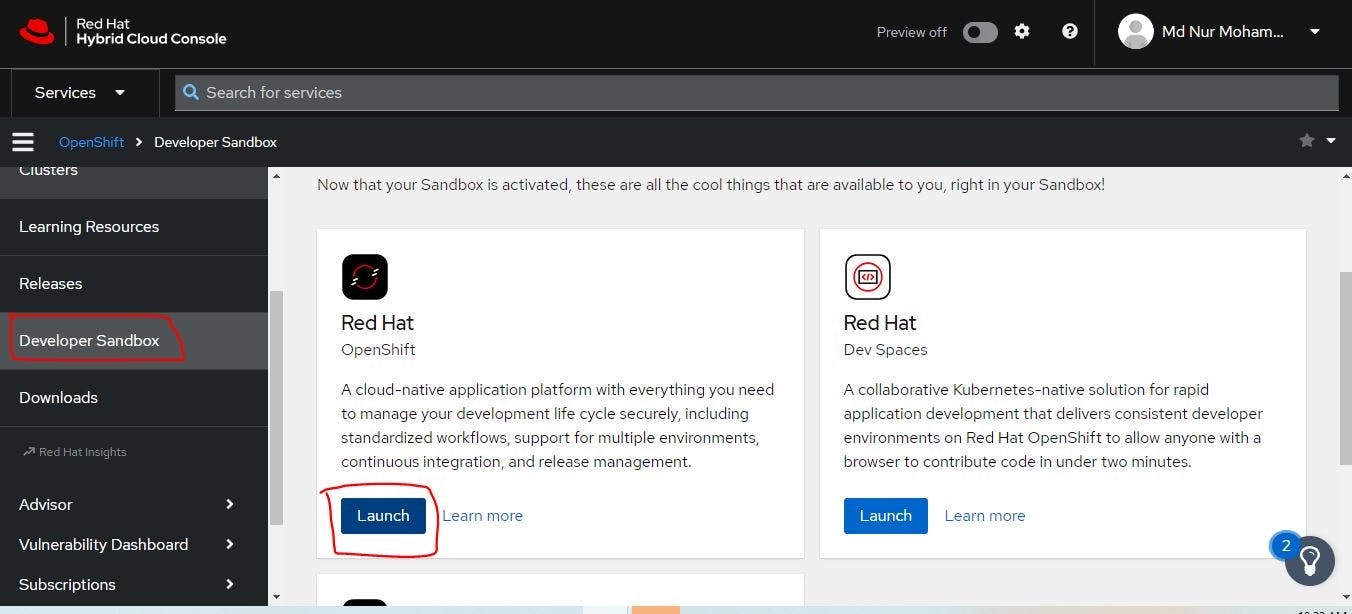
30 days free open-shift cluster
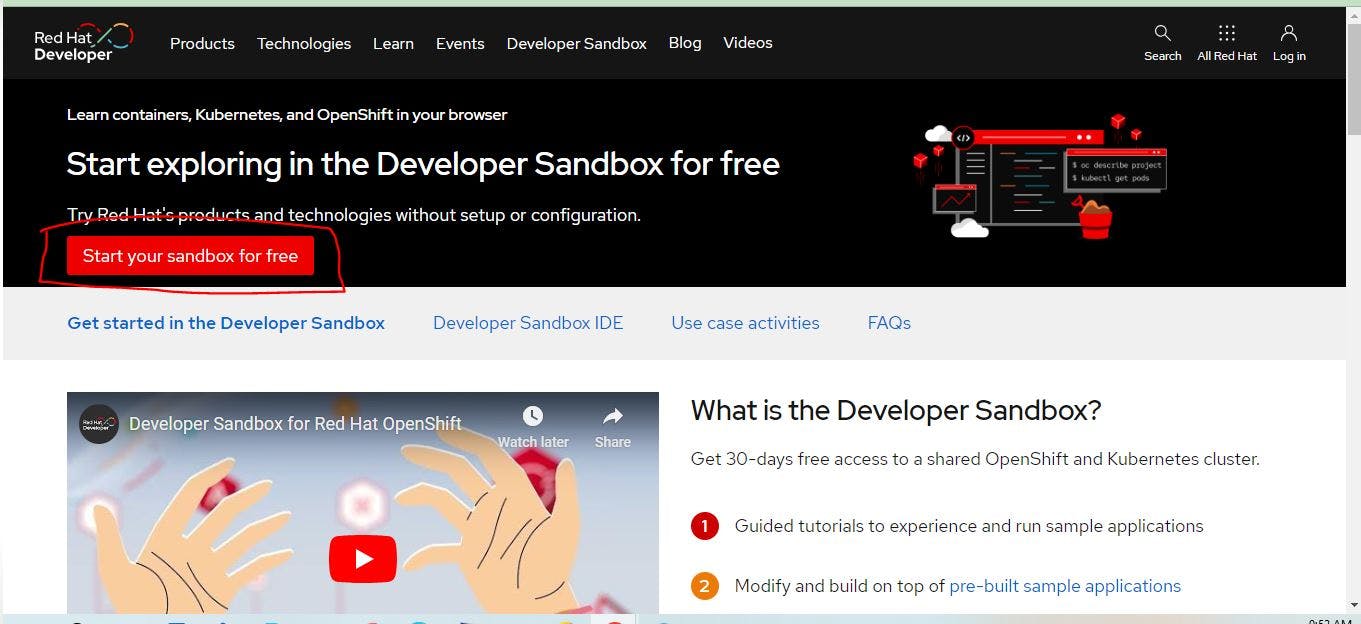
Link: https://developers.redhat.com/developer-sandbox
Go to this link and you will see 30 days free access to a shared OpenShift and Kubernetes cluster.
Click - start your sandbox for free
Once you did it you will see login to your Red Hat account page. you need to create a account in red hat. First create an account.
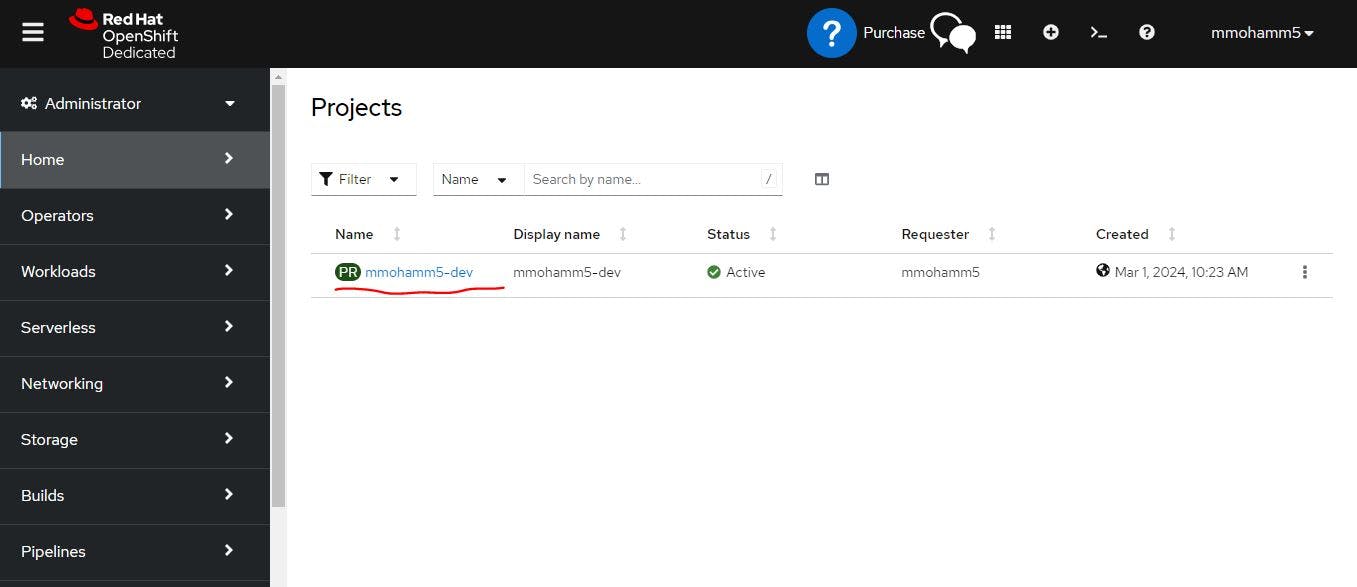
This is our shared cluster. which is free for 30 days. Here I can go to the workloads and I can see the pods . deployments, and so on.
Now click the user account side and copy login command for log in through CLI.
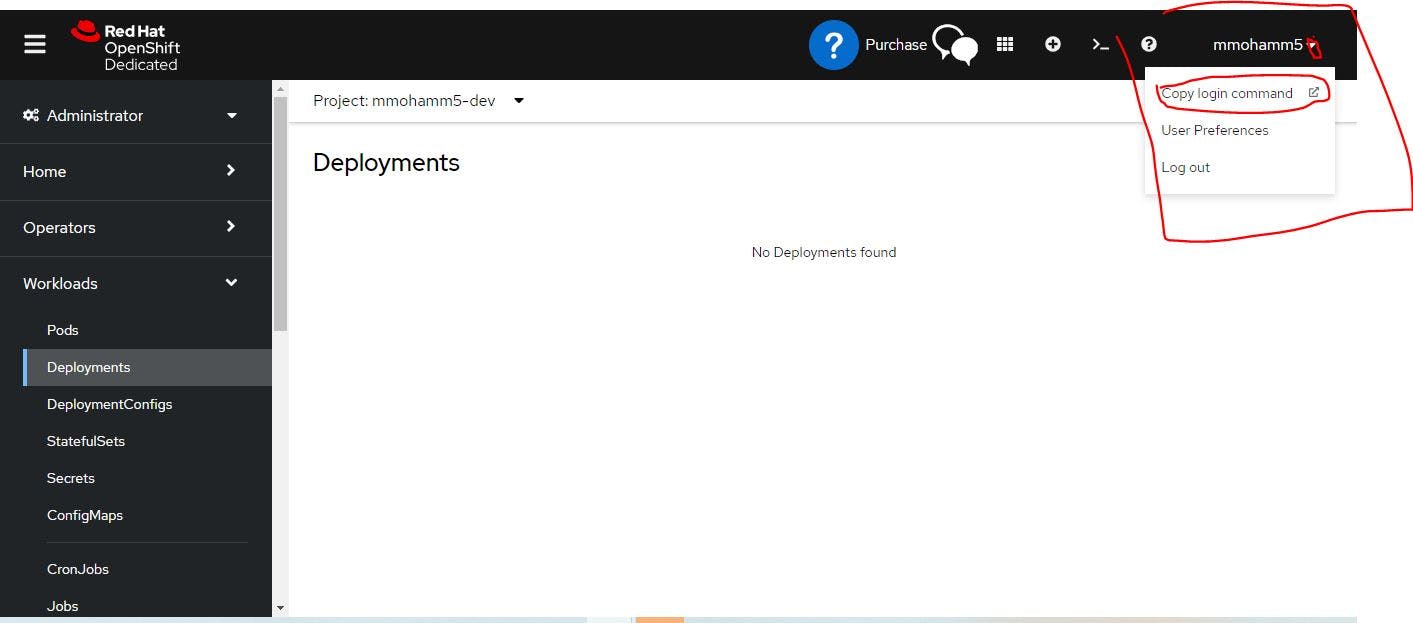
Now you will see the token. Which is needed for CLI connections.

Once you click display token, you will see this credentials information.
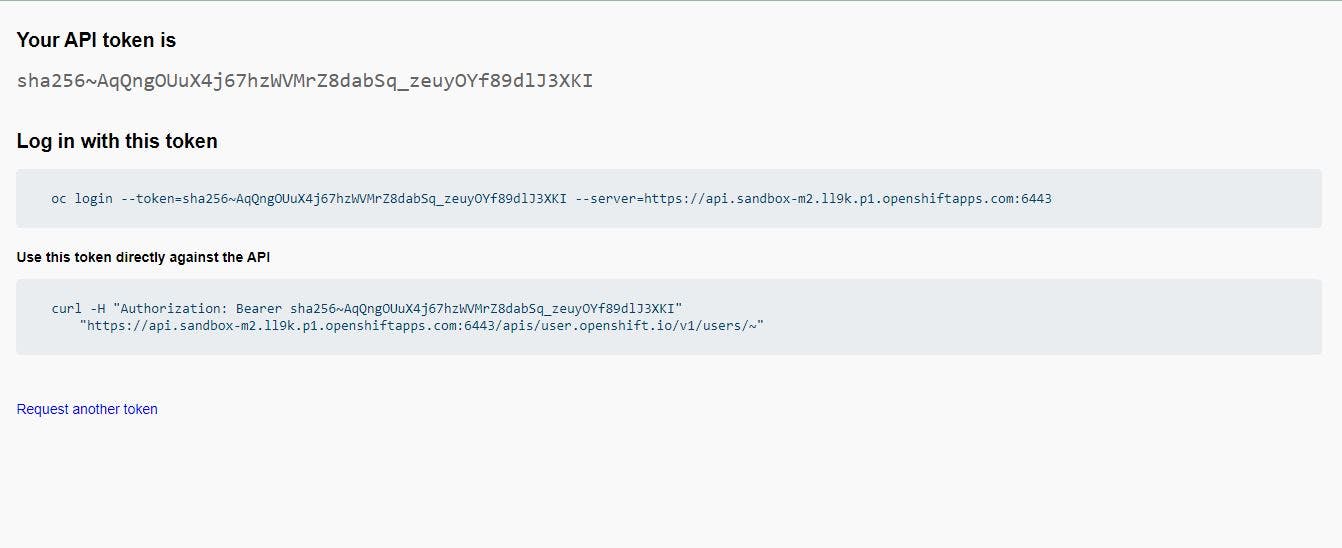
Now copy oc login into your linux server.
If oc is not there then install it.
wget https://github.com/openshift/okd/releases/download/4.5.0-0.okd-2020-07-14-153706-ga/openshift-client-linux-4.5.0-0.okd-2020-07-14-153706-ga.tar.gz
tar -xvf openshift-client-linux-4.5.0-0.okd-2020-07-14-153706-ga.tar.gz
sudo mv oc kubectl /usr/local/bin/
oc version
Now run the display token and you will get openshift cluster.
Now we will create a deployment.
kubectl create deployment nginx --image=nginx
Once you did it you can see your deployment is created. For this go to the openshift dashboard.
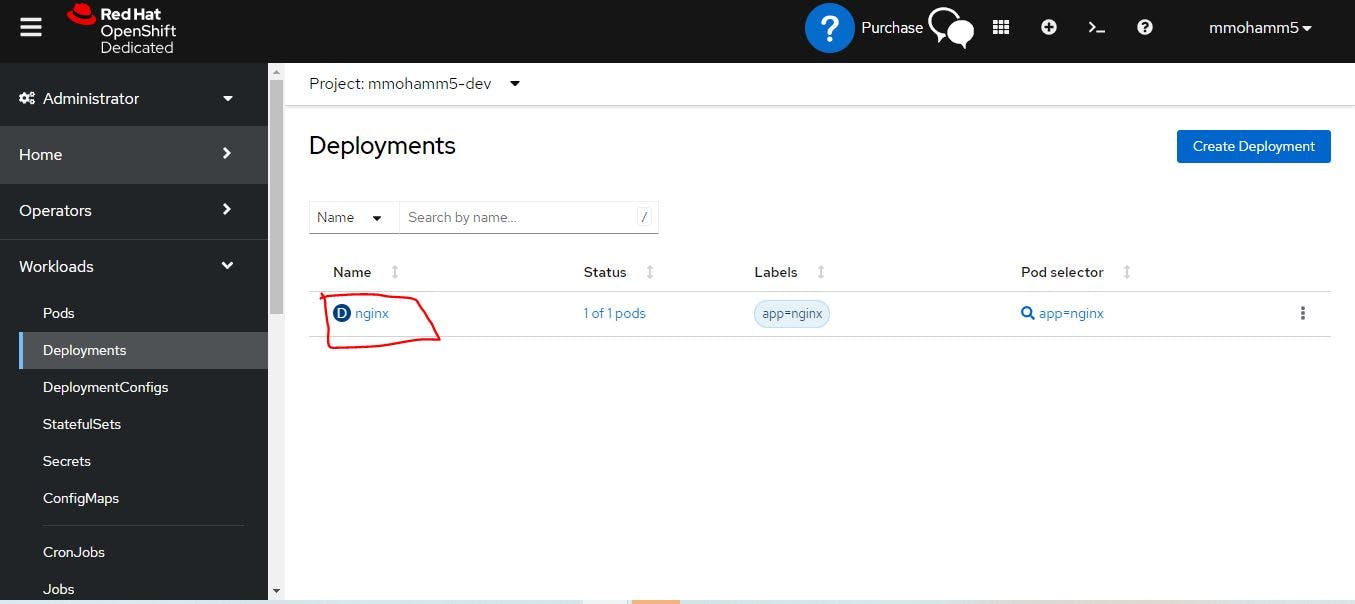
If you click nginx then you will see all of the information about pod.
Kubernetes Monitoring
Why monitoring?
Let's say in your organization you have one K8s Cluster. Whenever you have a single k8s cluster thats not a problem because for single k8s cluster but if a single cluster used by multiple teams , here one of the team says that in my k8s cluster something is going on , probably they will say that the deployment is not receiving the request or they will say the service is not accessible for a short while. So how do you solve it ? or at least how do you understand as a devops engineer.
As a k8s cluster keep growing then you would definitely need a monitoring platform.
Grafana is for visualization. prometheus give you lot of information using the queries like you can use the prom ql queries and you can get all the information about your k8s cluster. But for a better visualization you would need grafana.
Prometheus Architecture
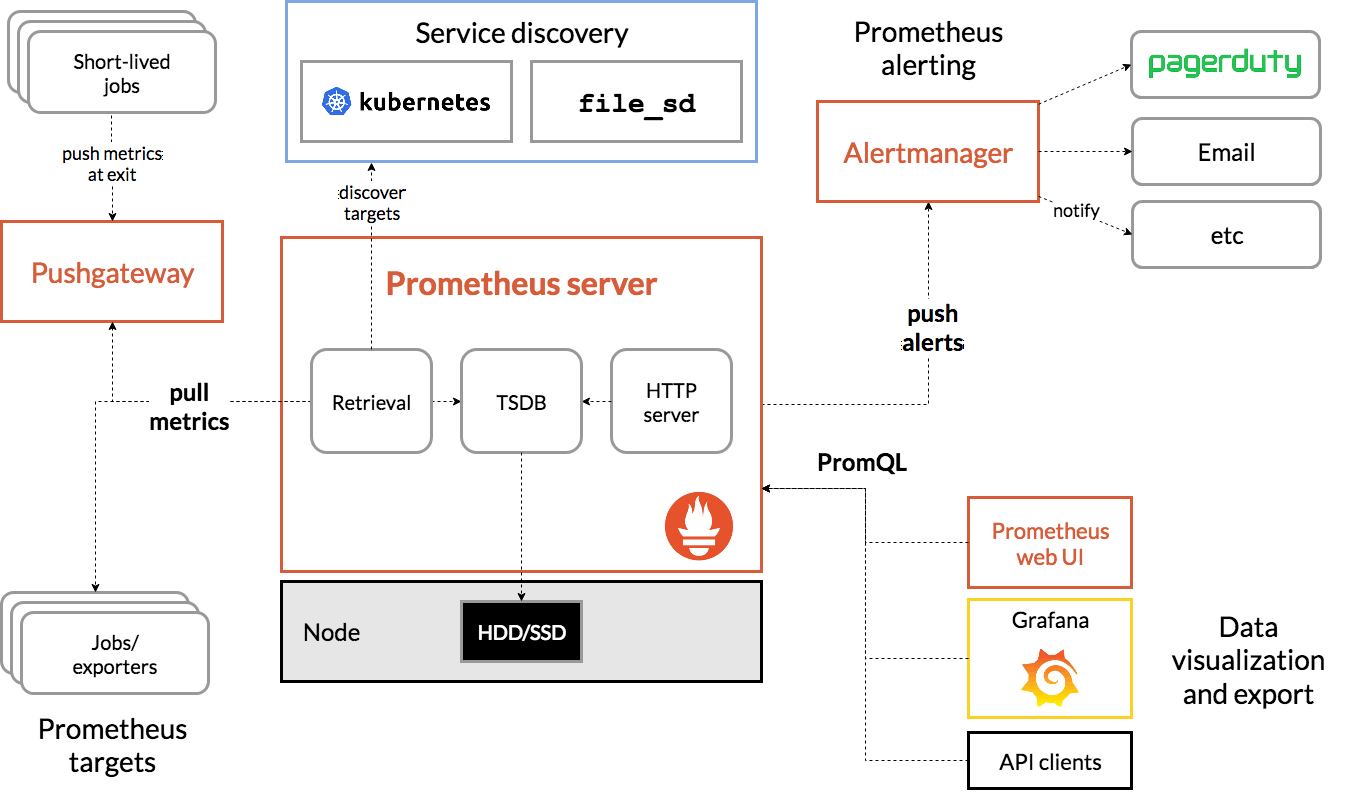
You have a k8s cluster (top of the figure). Prometheus server has a HTTP server and prometheus collects all the information from your k8s cluster by default your k8s has a API server and API server exposes a lot of metrics about your k8s cluster. Prometheus will try to fetch this k8s API server informations and it stores the entire information in in a time series database (TSDB). So all of this stored in HDD/SSD.
It has a monitoring systems like you can configure prometheus with alert manager and you can send notifications to different platforms probably you can send to slack or email etc. If you create the alert manager so prometheus can push the alerts to the alert manager and you can configure this alert manager to send out notifications to different places.
Apart from that, Prometheus provide a very good UI so, you can also go to the prometheus UI and you can execute some prom ql queries to get the information from prometheus whatever it has recorded or you can also use dashboard like grafana or AWS supports API and so on. Prometheus also support API you can also do some curl command or using postman you can get that information from prometheus.
Grafana
Grafana is a popular open-source data visualization and analytics platform that allows you to create custom dashboards and visualizations based on a variety of data sources. Grafana is often used for monitoring and analyzing metrics and logs in real-time, making it an ideal tool for monitoring systems and applications, including Kubernetes environments.
Grafana supports a wide range of data sources, including databases, time-series databases, and other data storage systems. It provides a powerful query language that allows you to retrieve and analyze data from these sources, and to create custom dashboards and alerts based on that data.
In addition to its powerful data visualization and analysis capabilities, Grafana is also highly extensible. It supports a wide range of plugins and integrations, including integrations with popular monitoring and logging tools like Prometheus, Elasticsearch, and InfluxDB.
Install minikube cluster by using hyperkit
minikube start --memory=4098 --driver=hyperkit
Install Monitoring Tools
By using helm or operators we can install prometheus. In a general practice operators offer a lot of advance capabilities like you can do life cycle management of your k8s controller using operators where you can install it. You can configure for automatic upgrades. Let's say tomorrow there is a new version of prometheus, operators are capable of upgrading your prometheus automatically.
Prometheus
helm repo add prometheus-community https://prometheus-community.github.io/helm-charts
helm repo update
helm install prometheus prometheus-community/prometheus
kubectl get pods
ubuntu@ip-172-31-83-8:~$ kubectl get pods
NAME                                                 READY   STATUS             RESTARTS          AGE
prometheus-alertmanager-0                            1/1     Running            0                 70s
prometheus-kube-state-metrics-78d874fb59-lccz6       1/1     Running            0                 70s
prometheus-prometheus-node-exporter-pn65q            1/1     Running            0                 70s
prometheus-prometheus-pushgateway-8647d94cf6-9ffr8   1/1     Running            0                 70s
prometheus-server-6598cc45d8-fbtm5                   2/2     Running            0                 70s
To want to know information about all the deployments all the pods all the services on your k8s cluster. You would want to know if the replica count is matching the expected replica account of all the deployments on your K8s cluster. For this Prometheus Kube-state-metrics do is : It will give you a lot of information about your existing K8s Cluster. So this information is beyond the information your K8s API server is providing. So that is the importance of this specific K8s controller.
Just do a new entry here:
kubectl expose service prometheus-server --type=NodePort --target-port=9090 --name=prometheus-server-ext
Now do minikube ip command and take the IP and take port number from
prometheus-server-ext NodePort 10.104.246.71 <none> 80:30678/TCP 3m57s
And open a tab and browse it. It will work.
Grafana
helm repo add grafana https://grafana.github.io/helm-charts
helm repo update
helm install grafana grafana/grafana
ubuntu@ip-172-31-83-8:~$ helm install grafana grafana/grafana
NAME: grafana
LAST DEPLOYED: Wed Mar  6 11:06:27 2024
NAMESPACE: default
STATUS: deployed
REVISION: 1
NOTES:
1. Get your 'admin' user password by running:

   kubectl get secret --namespace default grafana -o jsonpath="{.data.admin-password}" | base64 --decode ; echo


2. The Grafana server can be accessed via port 80 on the following DNS name from within your cluster:

   grafana.default.svc.cluster.local

   Get the Grafana URL to visit by running these commands in the same shell:
     export POD_NAME=$(kubectl get pods --namespace default -l "app.kubernetes.io/name=grafana,app.kubernetes.io/instance=grafana" -o jsonpath="{.items[0].metadata.name}")
     kubectl --namespace default port-forward $POD_NAME 3000

3. Login with the password from step 1 and the username: admin
#################################################################################
######   WARNING: Persistence is disabled!!! You will lose your data when   #####
######            the Grafana pod is terminated.                            #####
#################################################################################
You can here how to find password or other things. Read it properly.
kubectl get secret --namespace default grafana -o jsonpath="{.data.admin-password}" | base64 --decode ; echo
Now expose grafana service cluster IP to NodePort service as like as Prometheus.
kubectl expose service grafana --type=NodePort --target-port=3000 --name=grafana-ext
ubuntu@ip-172-31-83-8:~$ kubectl get svc
NAME                                  TYPE           CLUSTER-IP       EXTERNAL-IP   PORT(S)        AGE
grafana                               ClusterIP      10.99.27.219     <none>        80/TCP         5m30s
grafana-ext                           NodePort       10.99.18.73      <none>        80:31872/TCP   29s
See grafana -ext is added and the service type is NodePort. Now take minikube ip and the NodePort and browse it. In our case EC2 instance maybe not worked so in this case we will use ngrok tunneling service.
Now Run your Local K8s cluster in the browser. For this, we will use a tunnel(NGROK).
What we have done yet is based on my local. Now we need to give access to an Internet browser. For this, we will use ngrok.
ngrok: ngrok is a cross-platform application that enables developers to expose a local development server to the Internet with minimal effort. The software makes your locally-hosted web server appear to be hosted on a subdomain of ngrok.com, meaning that no public IP or domain name on the local machine is needed. Similar functionality can be achieved with Reverse SSH Tunneling, but this requires more setup as well as hosting of your own remote server.
Go to Google search ngrok and sign up it free.
Right-click the Linux option and copy the link address.
Go to your local server's command line and run the following command :
Note: Always follow update installation process: https://dashboard.ngrok.com/get-started/setup/linux
wget <link>
#wget https://bin.equinox.io/c/bNyj1mQVY4c/ngrok-v3-stable-linux-amd64.tgz
- Now we will see a zip file downloaded to our local server.
For example, ngrok-v3-stable-linux-amd64.tgz
- Unzip the tgz file by following the command.
tar -xvzf <file>
#example:
#tar -xvzf ngrok-v3-stable-linux-amd64.tgz
Note:x = for extract. v = for verbose. z = for gnuzip. f = for file
Authenticate yourself with ngrok: Go to the ngrok page and you will see under option 2 <Connect your account>. Now copy the command and run your local machine.
Now find your URL copy this (used in curl command) and make a command for ngrok like:
./ngrok http 192.168.49.2:32068
Note: If it appears as a 6022 error, then run the following command.
ngrok http 192.168.49.2:32068
The output will look like this:
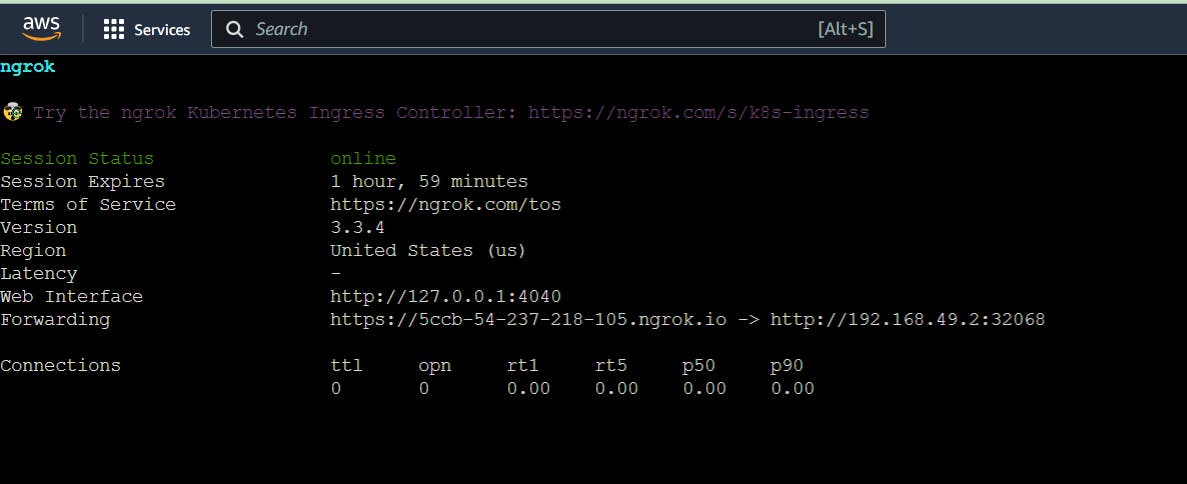
Note: It means ngrok makes a tunnel. Now copy the Forwarding link, paste it into a tab, and run it. Use two times , one for prometheus and other for grafana.
Once you got the access of Prometheus & Grafana into two tabs then go to the grafana dashboard. Import dashboard from Prometheus.
Grafana Access:
USER ID : admin
For password run the following command:
kubectl get secret --namespace default grafana -o jsonpath="{.data.admin-password}" | base64 --decode ; echo
Import dashboard URL or ID is 3662. This is basically template ID which gives a lot of information from Prometheus to grafana.
You will see dashboard like this:
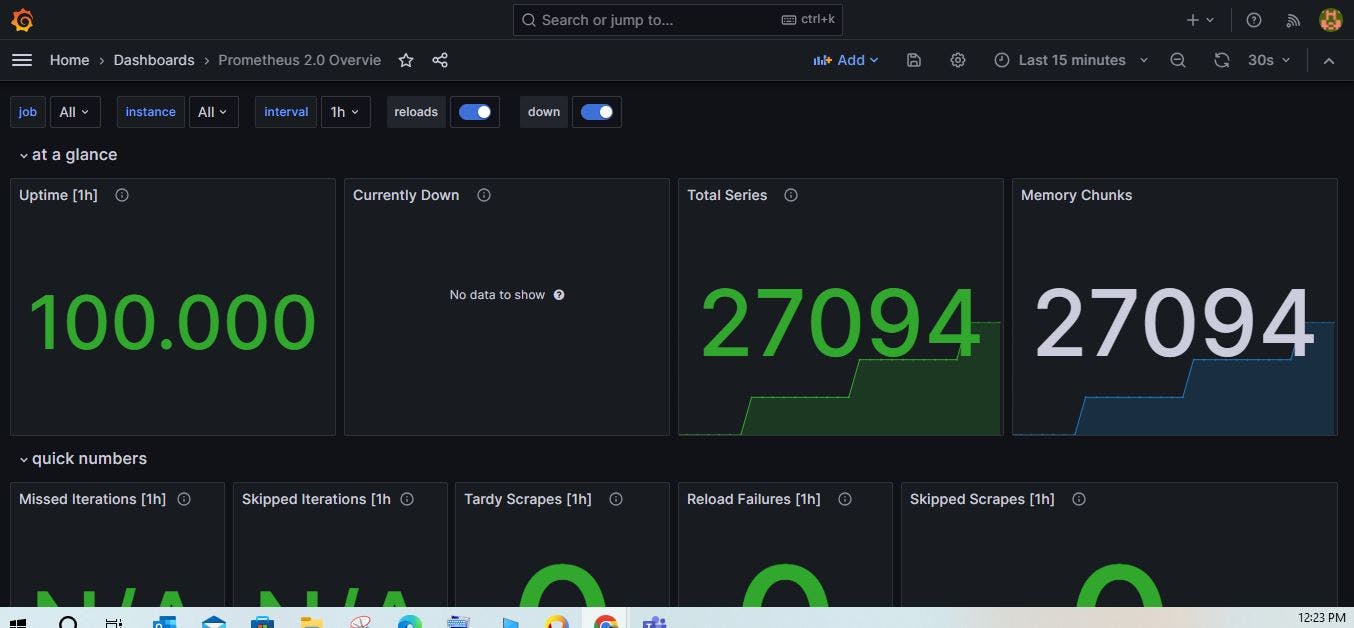
If you want to get any information from Prometheus server through grafana you have to run some PromQL queries.
In our case we got native K8s Services like API server, etcd, nodes and so on. If i want to know what is deployment status or what are the running replicas or current status of K8s services. For this we will use kube State metrix.
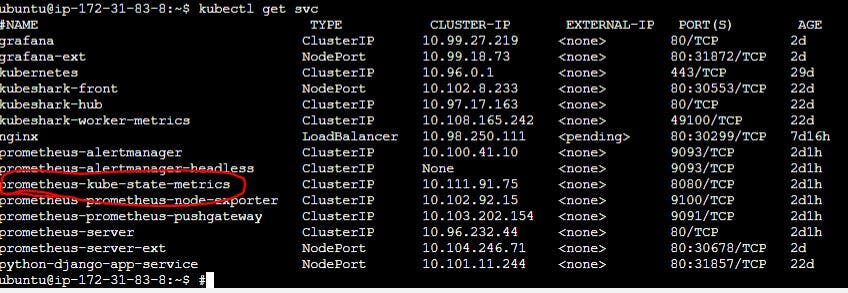
Expose this Kube state metrics.
kubectl expose service prometheus-kube-state-metrics --type=NodePort --target-port=8080 --name=prometheus-kube-state-metrics-ext
Once you run it you will get a new entry for this Prometheus kube state metrics as well.
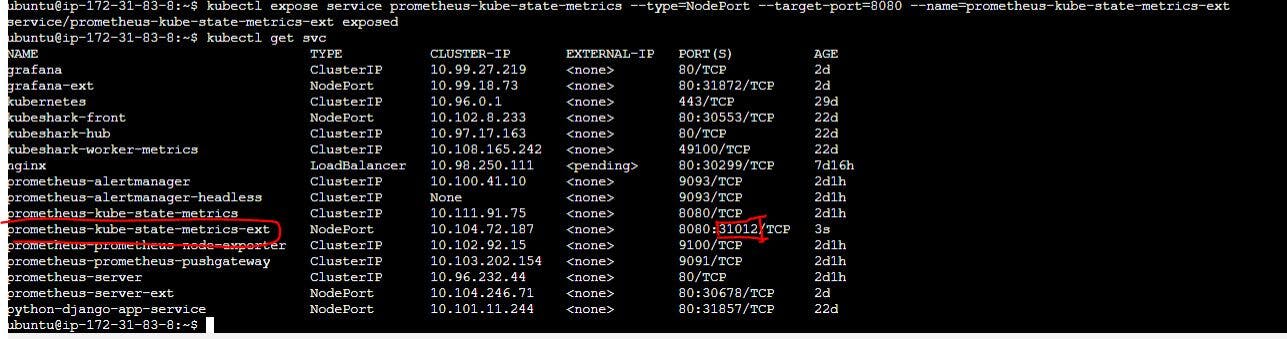
Now use ngrok tunneling to get access of this metrics.
ngrok http http://192.168.49.2:31012
You will see output like this.
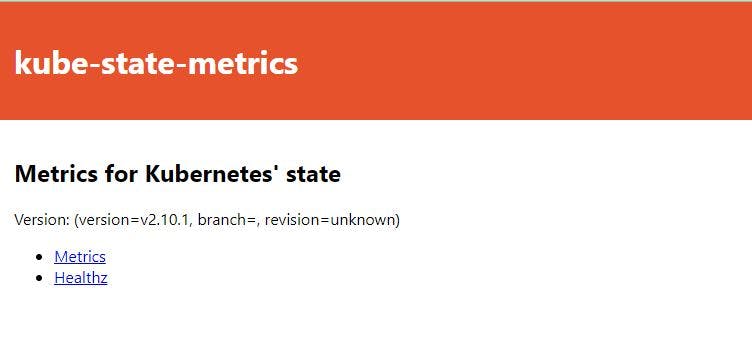
If you click Metrics the your will see all Metrics. This is metrics format information's. Where you are getting a lot of information's.
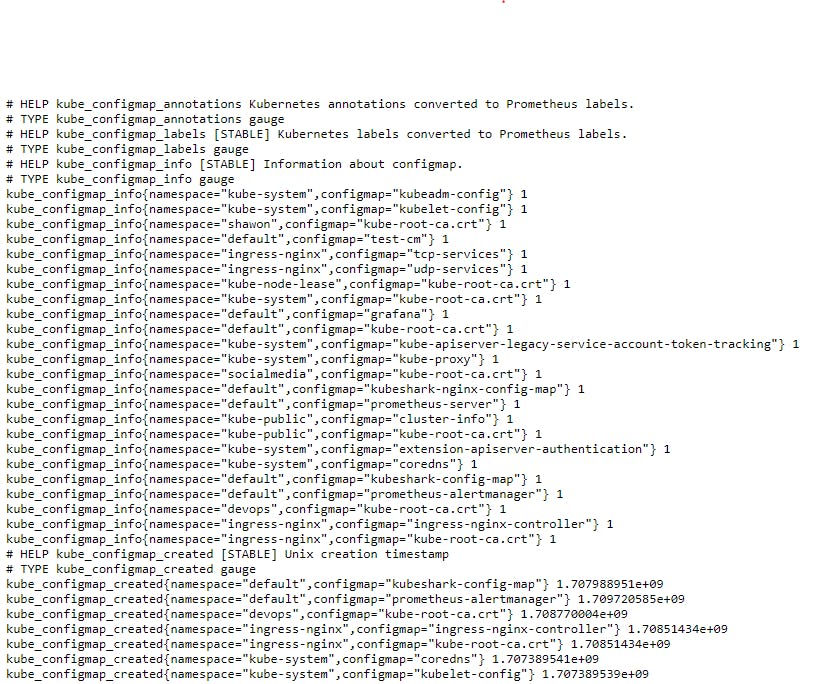
All of this information you can see grafana as well . Or just take any of this query like deployment
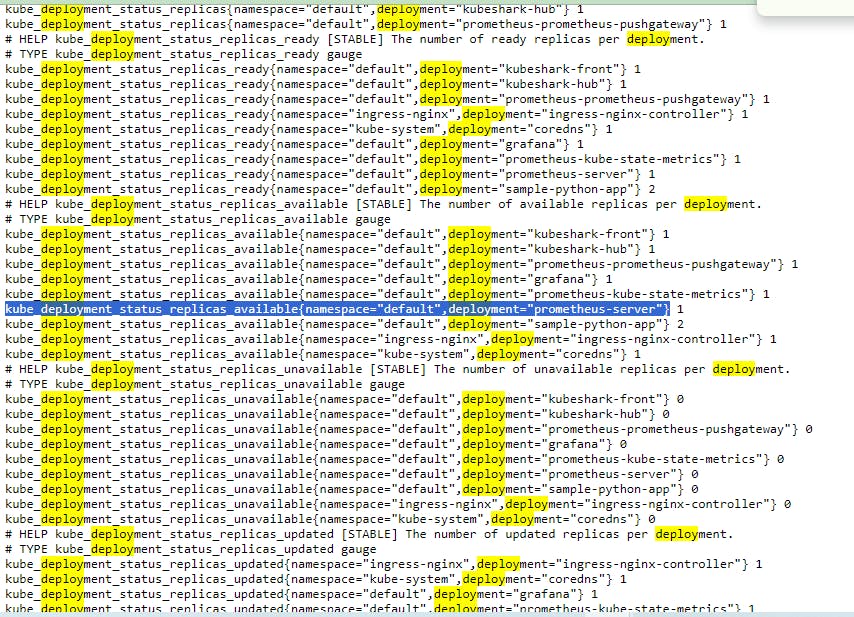
Execute this query to prometheus. copy this and execute it.
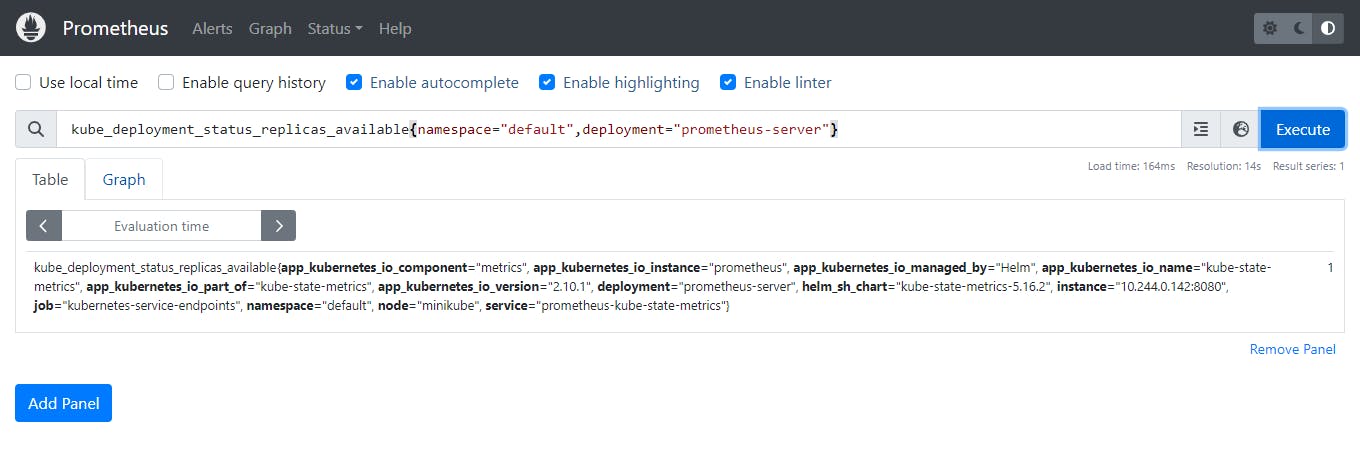
See this is the informations that Prometheus has written here. Grafana will use same informations by using in a visualizations pattern.
Custom Resources is K8s
Three things we will understand about custom resources.
CRD = Custom Resources definations
CR = Custom Resources
CC =Custom Controller
Within your k8s cluster by default there are some resources come out of the box for example deployment, service, pod, config map or secrets so these are the native k8s resources. Apart from these resources k8s says is if you want to extend the API of k8s or you want to introduce a new resource to k8s. Because if you feel the functionality that you need inside the k8s which is not supported by native resources for example k8s does not support advance security capabilities okay like kube hunter or kube varno or kube bench. So you need to add this resources in your k8s.
There are two actors here one is DevOps Engineer and other is user. So deploying the custom resource definition and custom controller is the responsibility of thew DevOps Engineer. And deploy the custom resource can be the action of user or DevOps Engineer.
ISTIO > Service
Argo CD > GitOps
Keyclock > tight identity and access management or authentications.
K8s can not add all of these logic or applications. So k8s will allow the users to extend the API capabilities of k8s. you can add a new API or API resources.
So, To extend the capabilities of API there are three resources in k8s.
CRD
CR
CC
CRD (Custom resources defination) : It means you are defining a new type of API to k8s. So CRD is yml file. In this yml file you will define what a user can create. for example you are a user or you are a user who are creating a deployment or yml file so in your deploment.yml file you will write lot of steps like, kind, replicas and so on apart from these if you arite any thing then k8s will show you error because because will match your deploymen.yml file with his own deployment template. Similarly the custom resource will work but k8s need to know all of things. All happend through CRD.