Grafana basics


Grafana is an open-source analytics and monitoring platform that integrates with various data sources to enable users to visualize and understand their data better. It is commonly used for monitoring and observability in IT environments, providing real-time insights into systems, applications, and infrastructure. Grafana supports a wide range of data sources, including popular databases, cloud services, and custom APIs.
Key features of Grafana include:
Data Visualization: Grafana allows users to create interactive and customizable dashboards with a variety of panels, such as graphs, tables, and heat maps. Users can visualize data from multiple sources on a single dashboard.
Data Querying: Grafana supports querying data from different databases and systems, including Graphite, Prometheus, InfluxDB, Elasticsearch, MySQL, and more. Users can create queries to fetch and display specific data on their dashboards.
Alerting: Grafana provides alerting capabilities, allowing users to set up alerts based on defined thresholds. When certain conditions are met, Grafana can trigger notifications via email, Slack, or other communication channels.
Plugins and Integrations: Grafana has a plugin architecture that allows users to extend its functionality. There are numerous plugins available for integrating with various data sources and services.
User Authentication and Authorization: Grafana supports user authentication and authorization, allowing administrators to control access to dashboards and features. It integrates with authentication providers like OAuth, LDAP, and others.
Community and Ecosystem: Grafana has a vibrant and active community that contributes to its development and provides support. The platform has become a standard tool for monitoring and visualization in many organizations.
Templating: Grafana supports templating, allowing users to create dynamic dashboards that adapt to changing conditions. Templating can be used for variables in queries, making it easier to explore and analyze different aspects of the data.
Annotations: Users can add annotations to their dashboards to mark events or changes in the data. Annotations help provide context to the visualized information.
Grafana is widely used in DevOps, system monitoring, and application performance monitoring. It plays a crucial role in helping organizations gain insights into their systems and make data-driven decisions. The flexibility and extensibility of Grafana make it a popular choice for creating and sharing dashboards across teams.
Loki

Loki is an open-source log aggregation system that is often used in conjunction with Grafana for log analysis and monitoring. It is part of the Cloud Native Computing Foundation (CNCF) and was originally developed by Grafana Labs. Loki is designed to be highly efficient and cost-effective, particularly in cloud-native and containerized environments.
Key features of Loki include:
Log Aggregation: Loki is designed to aggregate and store log data from various sources. It enables users to centralize logs for easy analysis and troubleshooting.
Labels and Queries: Similar to Prometheus, Loki uses labels to organize and query log data efficiently. Labels help users filter and search for specific log entries based on different criteria.
Prometheus-style Queries: Loki uses a query language similar to Prometheus, making it familiar for users who are already accustomed to Prometheus for metrics collection and monitoring.
Distributed Architecture: Loki has a distributed architecture that scales horizontally, making it suitable for handling large volumes of log data in dynamic and cloud-native environments.
Efficient Storage: Loki uses a chunk-based storage system, where logs are compressed and stored in chunks. This approach is designed to be more storage-efficient than traditional log storage systems.
Integration with Grafana: Loki integrates seamlessly with Grafana, allowing users to visualize log data alongside other metrics on Grafana dashboards. This integration provides a unified platform for monitoring and troubleshooting.
Cost-Effective: Loki is designed to be cost-effective, particularly in cloud environments. Its efficient storage mechanism and ability to scale horizontally make it well-suited for environments where cost and scalability are critical factors.
Loki is commonly used in Kubernetes environments, where it can efficiently handle the large volume of logs generated by containerized applications. The combination of Prometheus for metrics and Loki for logs, along with Grafana for visualization, creates a powerful observability stack that helps organizations gain insights into the performance and health of their systems.
Promtail

Promtail is a component of the Loki project and serves as the agent responsible for collecting and forwarding log entries to Loki for storage and analysis. Loki is a log aggregation system that integrates with Grafana, and Promtail acts as the collector for log entries in the context of Loki.
Key features and functionalities of Promtail include:
Log Collection: Promtail is designed to collect log entries from various sources, making it an essential component for centralizing log data. It supports log entries from files, system logs, and other log sources.
Labeling and Structured Logging: Similar to Prometheus and Loki, Promtail supports labels, allowing users to attach metadata to log entries. This helps in organizing and querying log data effectively. Promtail also encourages structured logging, which means log entries are formatted in a way that makes it easier to parse and analyze.
Log Discovery: Promtail supports dynamic service discovery to identify and collect logs from different services and applications. This is particularly useful in dynamic environments like Kubernetes, where services can be added or removed dynamically.
Integration with Loki: Promtail is tightly integrated with Loki and is designed to work seamlessly with Loki's storage and querying capabilities. It sends log entries to Loki, where they can be stored efficiently and queried using the same labels and querying language (LogQL) as Prometheus.
Relabeling and Processing: Promtail provides options for relabeling and processing log entries before forwarding them to Loki. This allows users to transform log entries, filter specific data, or add additional metadata before storage.
Efficient Log Storage: Promtail, in conjunction with Loki, uses a chunk-based storage system for log entries. This storage mechanism is designed to be efficient in terms of storage space and retrieval.
Scalability: Promtail can be deployed across multiple instances to scale horizontally, allowing it to handle large volumes of log data in distributed and dynamic environments.
Configuration and Flexibility: Promtail is highly configurable, allowing users to specify the log sources, labels, and other parameters based on their specific requirements. This flexibility makes it suitable for a wide range of use cases.
Install Grafana on Ubuntu
Run the following command to install grafana correctly:
Link: https://grafana.com/docs/grafana/latest/setup-grafana/installation/debian/
Install the prerequisite packages:
sudo apt-get install -y apt-transport-https software-properties-common wgetImport the GPG key:
 sudo mkdir -p /etc/apt/keyrings/
 wget -q -O - https://apt.grafana.com/gpg.key | gpg --dearmor | sudo tee /etc/apt/keyrings/grafana.gpg > /dev/null
To add a repository for stable releases, run the following command:
echo "deb [signed-by=/etc/apt/keyrings/grafana.gpg] https://apt.grafana.com stable main" | sudo tee -a /etc/apt/sources.list.d/grafana.listTo add a repository for beta releases, run the following command:
echo "deb [signed-by=/etc/apt/keyrings/grafana.gpg] https://apt.grafana.com beta main" | sudo tee -a /etc/apt/sources.list.d/grafana.listRun the following command to update the list of available packages:
 # Updates the list of available packages
 sudo apt-get update
To install Grafana OSS, run the following command:
 # Installs the latest OSS release:
 sudo apt-get install grafana
To install Grafana Enterprise, run the following command:
 # Installs the latest Enterprise release:
 sudo apt-get install grafana-enterprise
To keep active and start your Grafana, run the following command:
  sudo apt-get update
  sudo /bin/systemctl start grafana-server
  sudo /bin/systemctl enable grafana-server
Now, open the 3000 port because Grafana uses this port.
Now browse the Grafana and set a new password. By default, the user name and password are 'admin'.
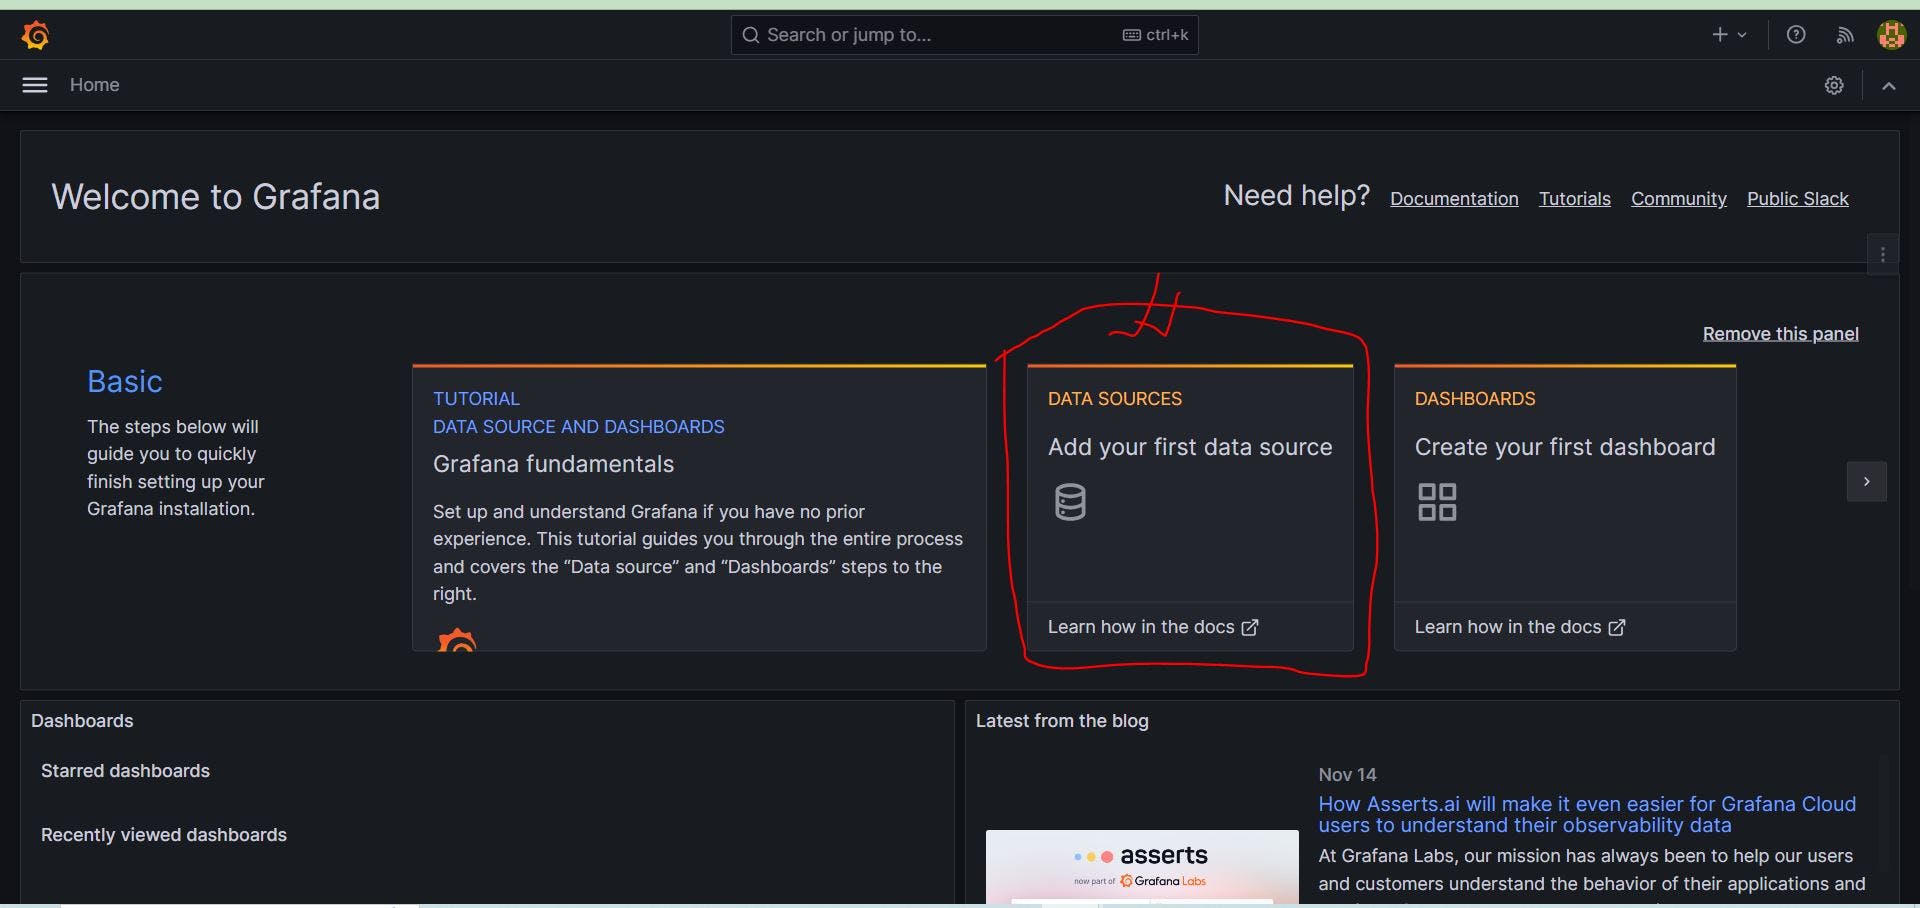
Grafana needs a data source. Now add a data source. Click on the data source.
Once we do it, we need to install Loki.
Install Loki and Promtail using Docker
Run the following command to download Loki Config:
Note: If Docker is not installed, then install Docker.
wget https://raw.githubusercontent.com/grafana/loki/v2.9.1/cmd/loki/loki-local-config.yaml -O loki-config.yaml
Run Loki Docker Container
docker run --name loki -d -v $(pwd):/mnt/config -p 3100:3100 grafana/loki:2.9.1 -config.file=/mnt/config/loki-config.yaml
Download Promtail Config
wget https://raw.githubusercontent.com/grafana/loki/v2.9.1/clients/cmd/promtail/promtail-docker-config.yaml -O promtail-config.yaml
Run Promtail Docker Container
docker run --name promtail -d -v $(pwd):/mnt/config -v /var/log:/var/log --link loki grafana/promtail:2.9.1 -config.file=/mnt/config/promtail-config.yaml
loki-config.yaml
auth_enabled: false

server:
  http_listen_port: 3100
  grpc_listen_port: 9096

common:
  instance_addr: 127.0.0.1
  path_prefix: /tmp/loki
  storage:
    filesystem:
      chunks_directory: /tmp/loki/chunks
      rules_directory: /tmp/loki/rules
  replication_factor: 1
  ring:
    kvstore:
      store: inmemory

query_range:
  results_cache:
    cache:
      embedded_cache:
        enabled: true
        max_size_mb: 100

schema_config:
  configs:
    - from: 2020-10-24
      store: boltdb-shipper
      object_store: filesystem
      schema: v11
      index:
        prefix: index_
        period: 24h

ruler:
  alertmanager_url: http://localhost:9093

# By default, Loki will send anonymous, but uniquely-identifiable usage and configuration
# analytics to Grafana Labs. These statistics are sent to https://stats.grafana.org/
#
# Statistics help us better understand how Loki is used, and they show us performance
# levels for most users. This helps us prioritize features and documentation.
# For more information on what's sent, look at
# https://github.com/grafana/loki/blob/main/pkg/usagestats/stats.go
# Refer to the buildReport method to see what goes into a report.
#
# If you would like to disable reporting, uncomment the following lines:
#analytics:
#  reporting_enabled: false
promtail-config.yaml
server:
  http_listen_port: 9080
  grpc_listen_port: 0

positions:
  filename: /tmp/positions.yaml

clients:
  - url: http://loki:3100/loki/api/v1/push

scrape_configs:
- job_name: system
  static_configs:
  - targets:
      - localhost
    labels:
      job: varlogs
      __path__: /var/log/*log
- Loki is running at port 3100. So, open this port. Now, take public IP and port with /ready.
Example: http://54.82.47.108:3100/ready
To see the Loki metrics, browse like this: http://54.82.47.108:3100/metrics
This does not look like a good presentation. So, we need to send these logs to Grafana. Importantly, Loki collects all logs from Promtail.
Now we need to link Loki and Promtail. For this, go to the Grafana dashboard and add a data source. We need Loki, so select Loki.
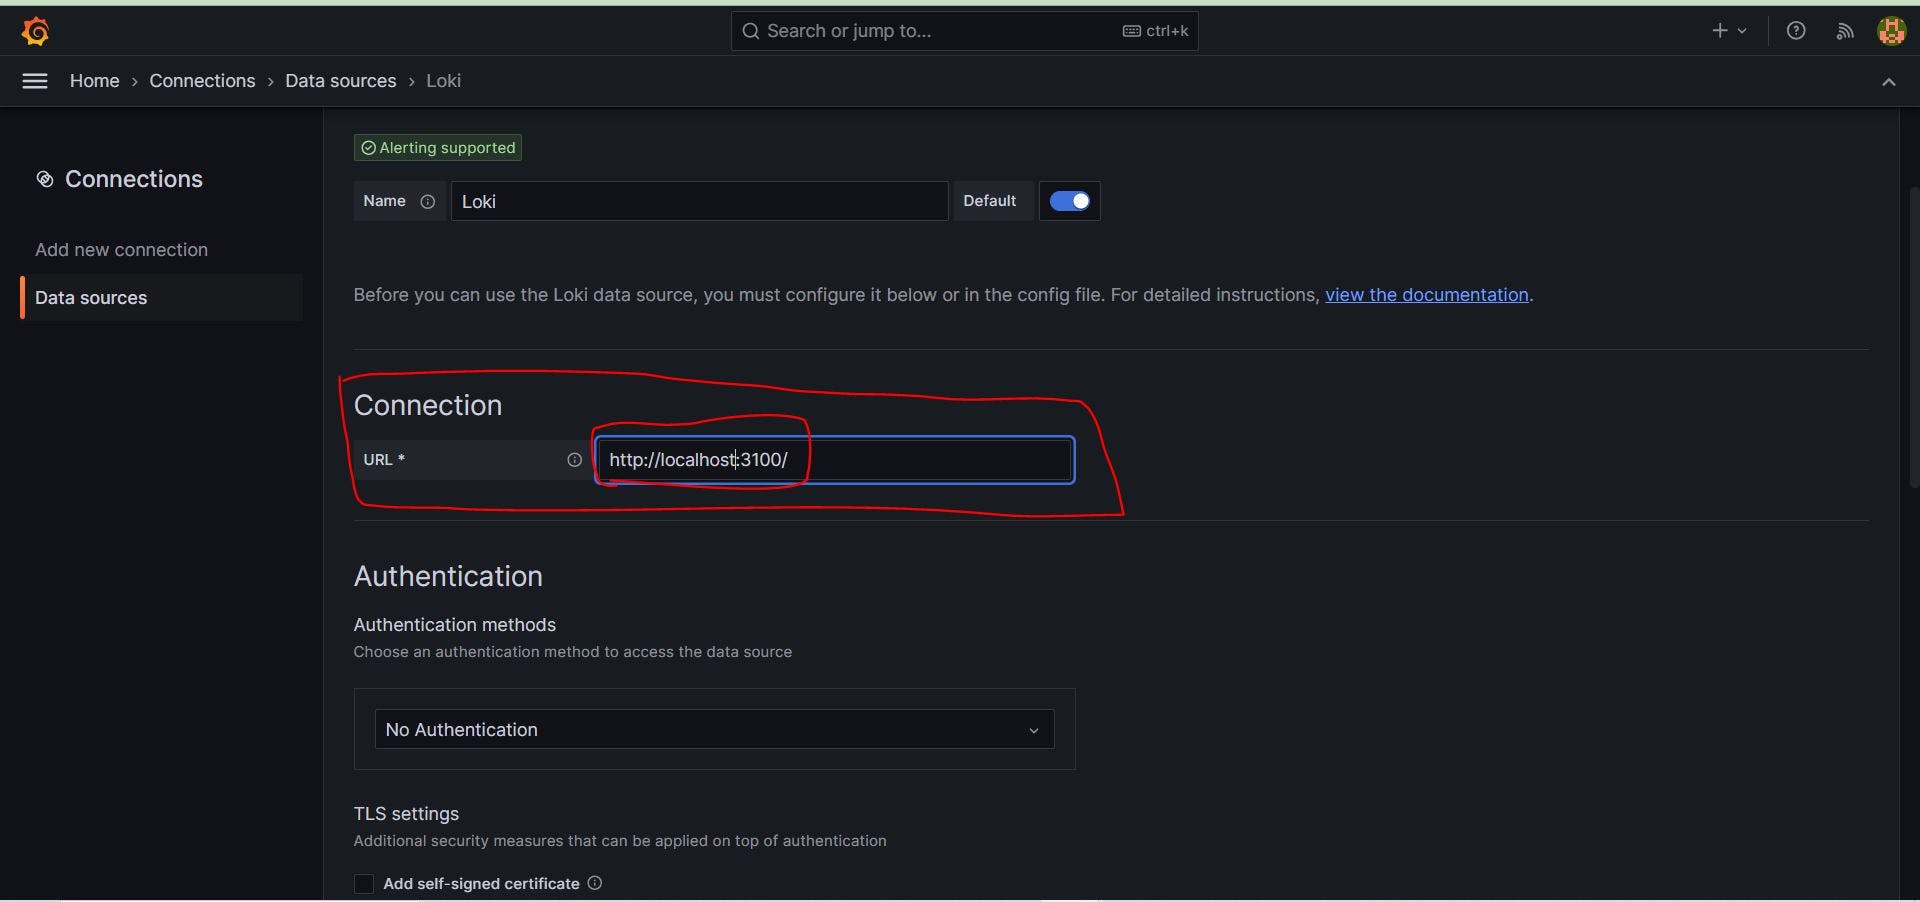
In connection, step rewrites like this; scroll down, save, and test it.
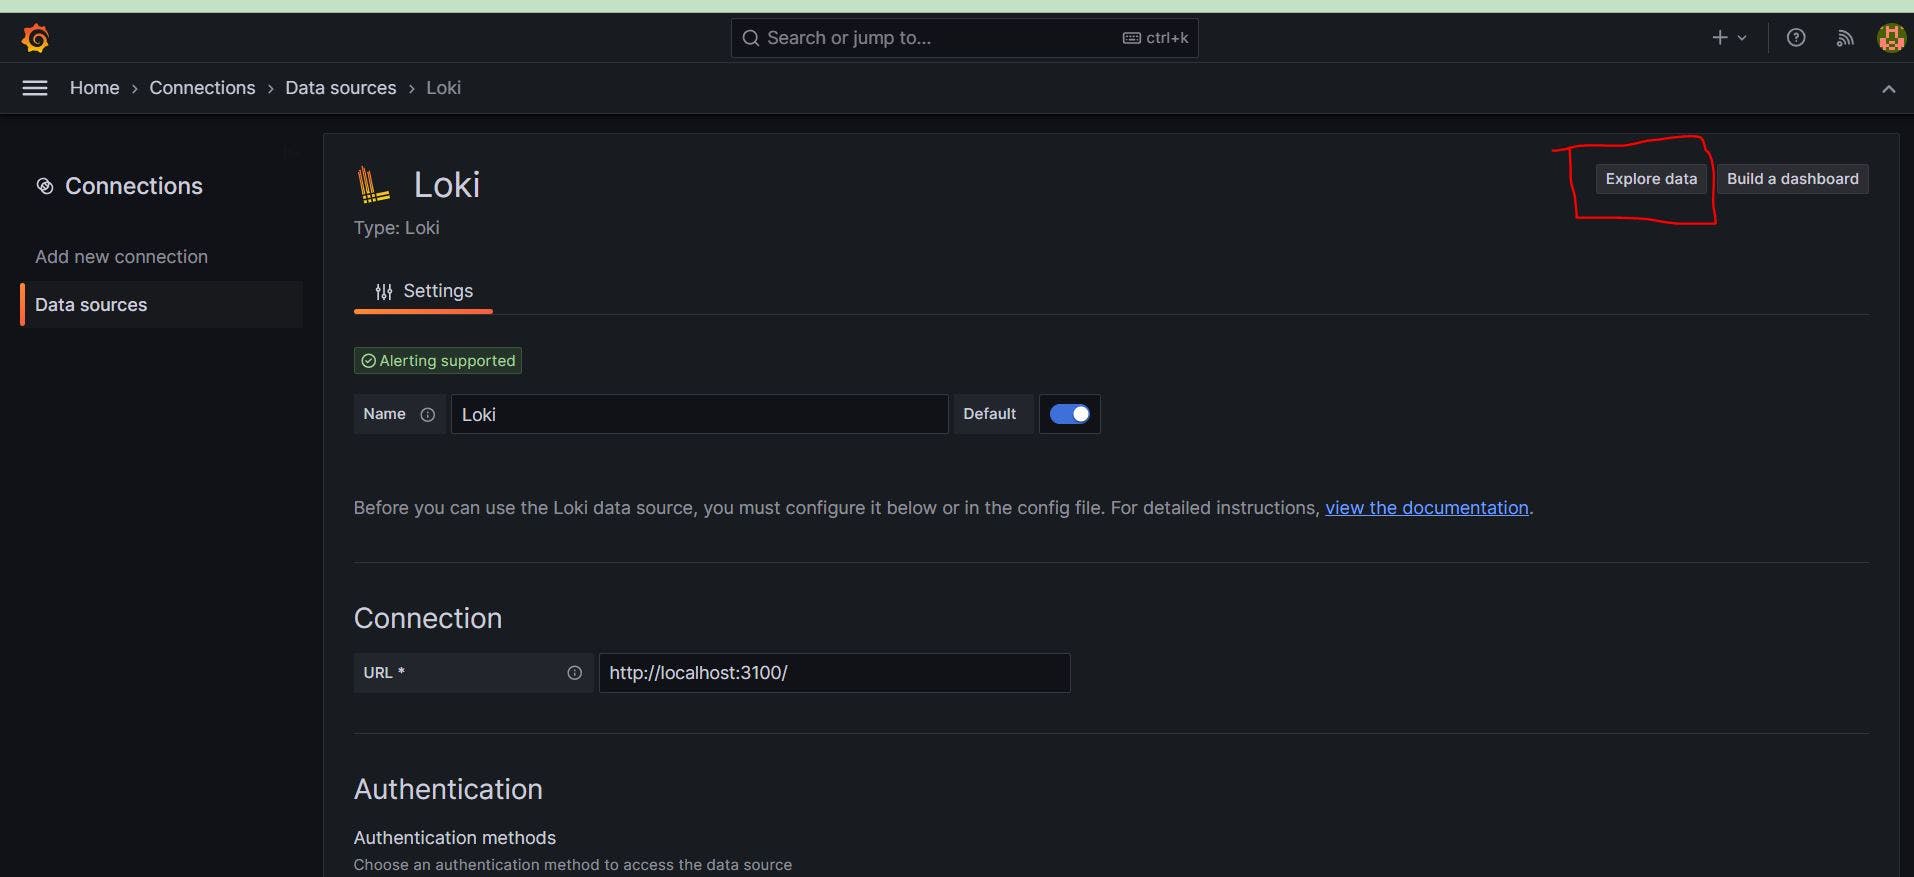
Now go to the top right corner and explore the data.
It looks like this.
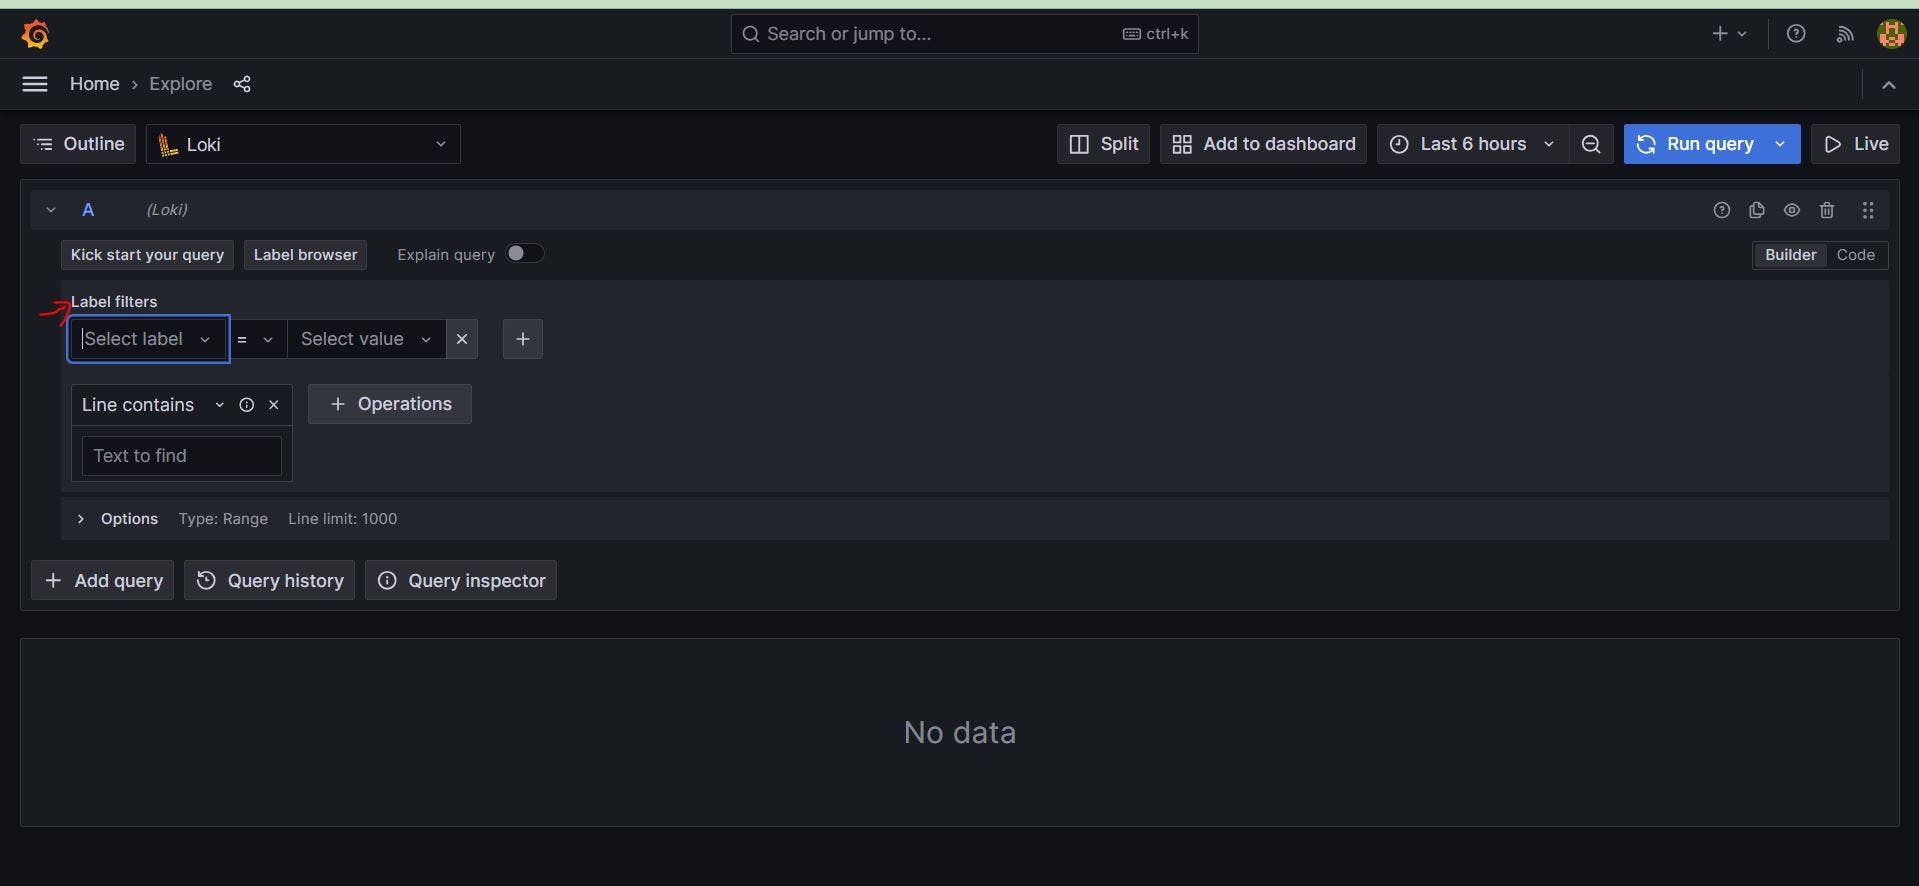
Here, we can see the label filter option, and this is for the job or file name. In our case, we need a job or file. So, go to the Promtail-config.yaml file and see the log file.
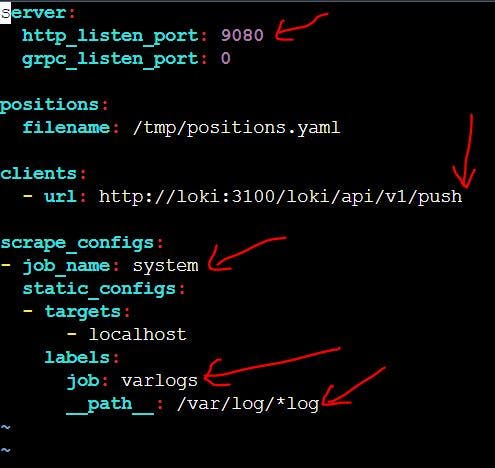
Here, we can see all logs are stored in a job named varlogs so go to the Grafana Explore Data page and select job and varlogs After that, run a query.
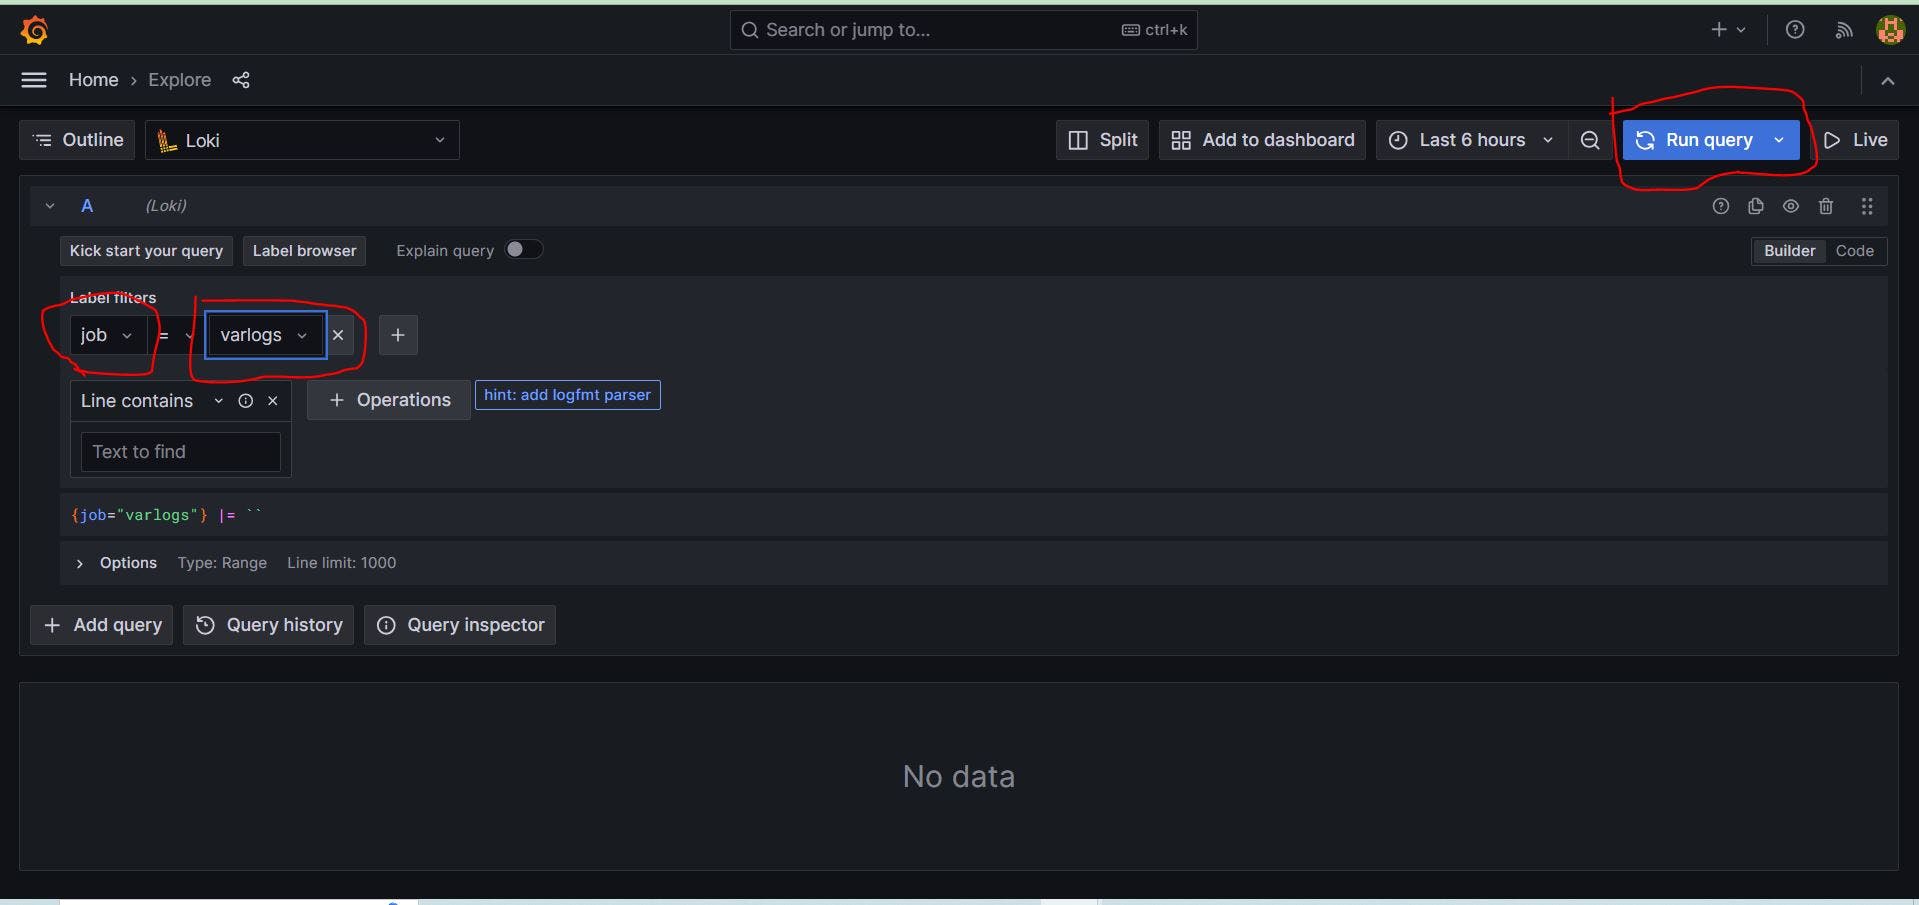
After running the query,
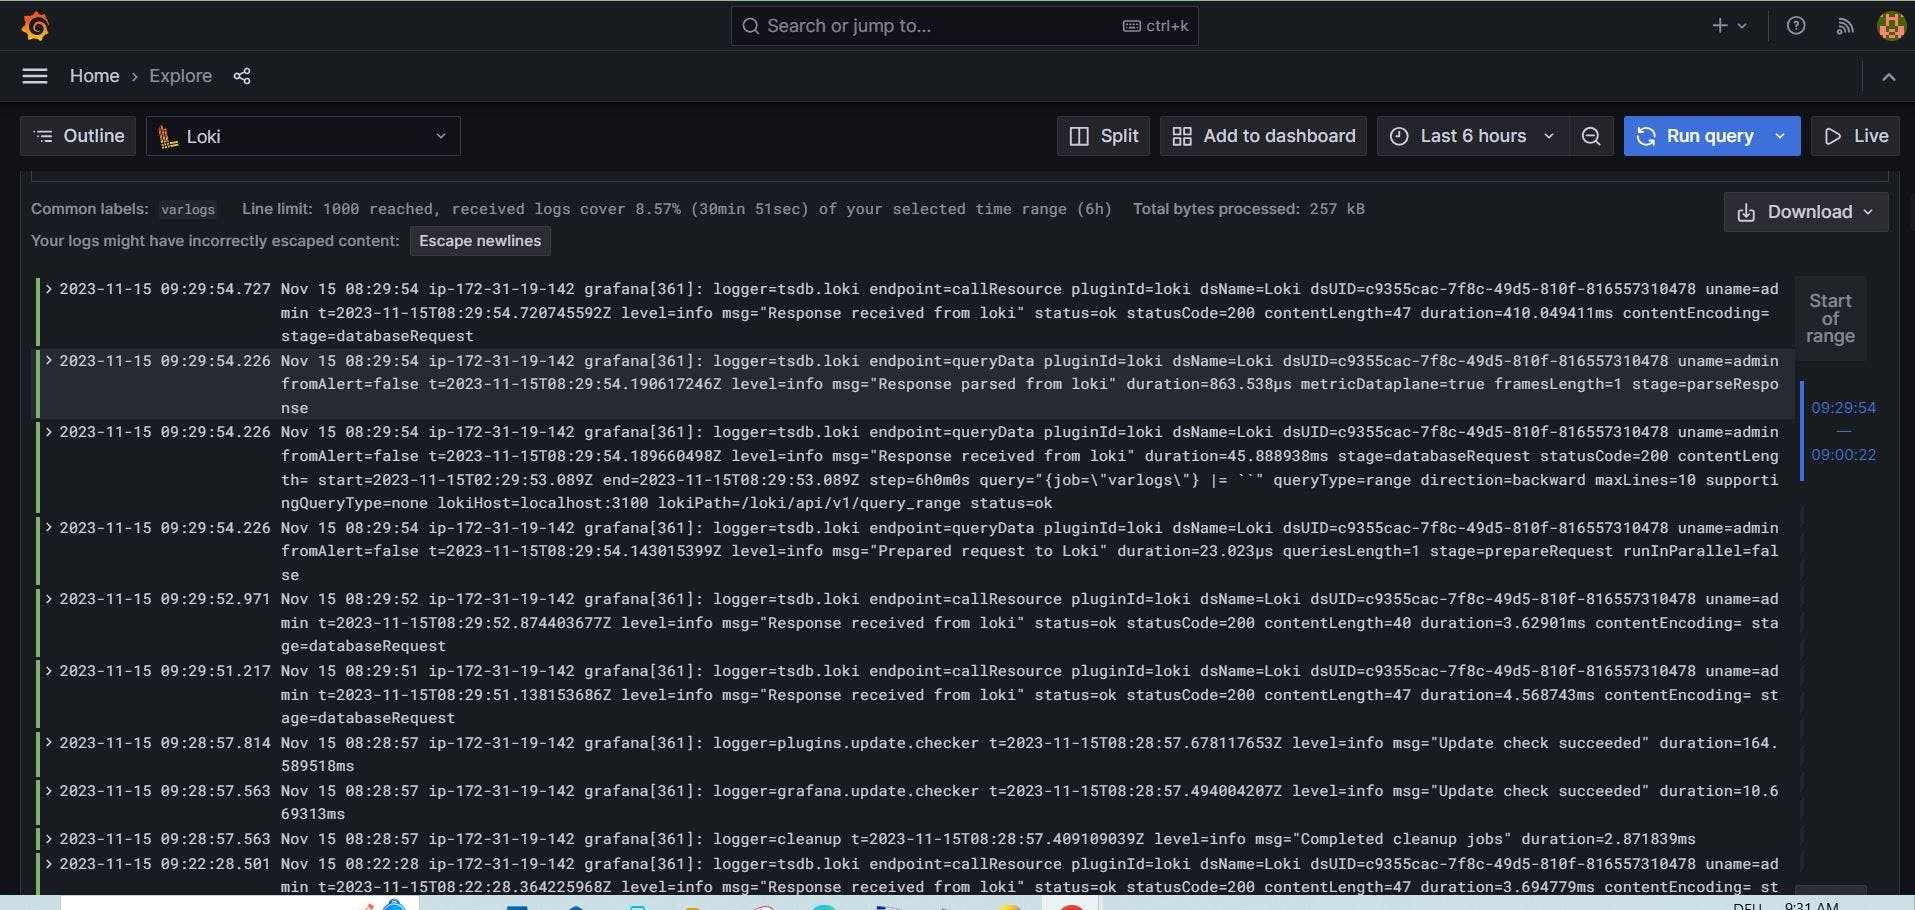
Now we want to see the Grafana log file through Loki. For this first, go to /var directories and find logs.
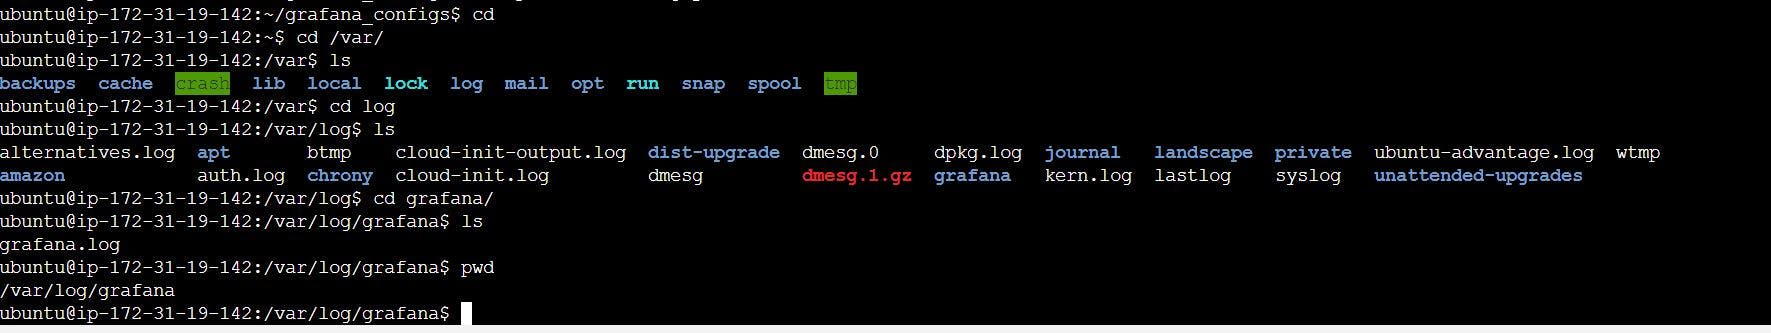
Copy the present working directory and tell Promtail to take these logs and send them to Loki, and Loki will show them in Grafana.
For this, edit the Promtail-config.yaml file and add a new target.
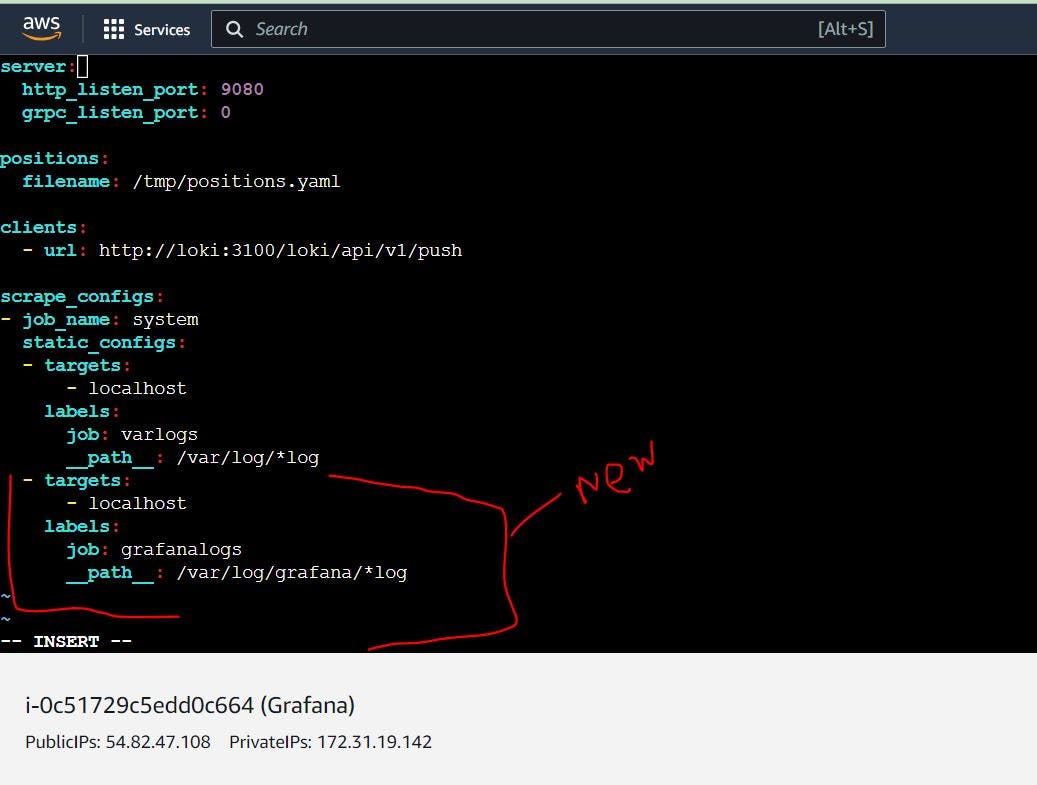
Now, it needs to restart Promtail. For this restart, docker promtail contaier.
Run this command:
docker restart "container_ID"
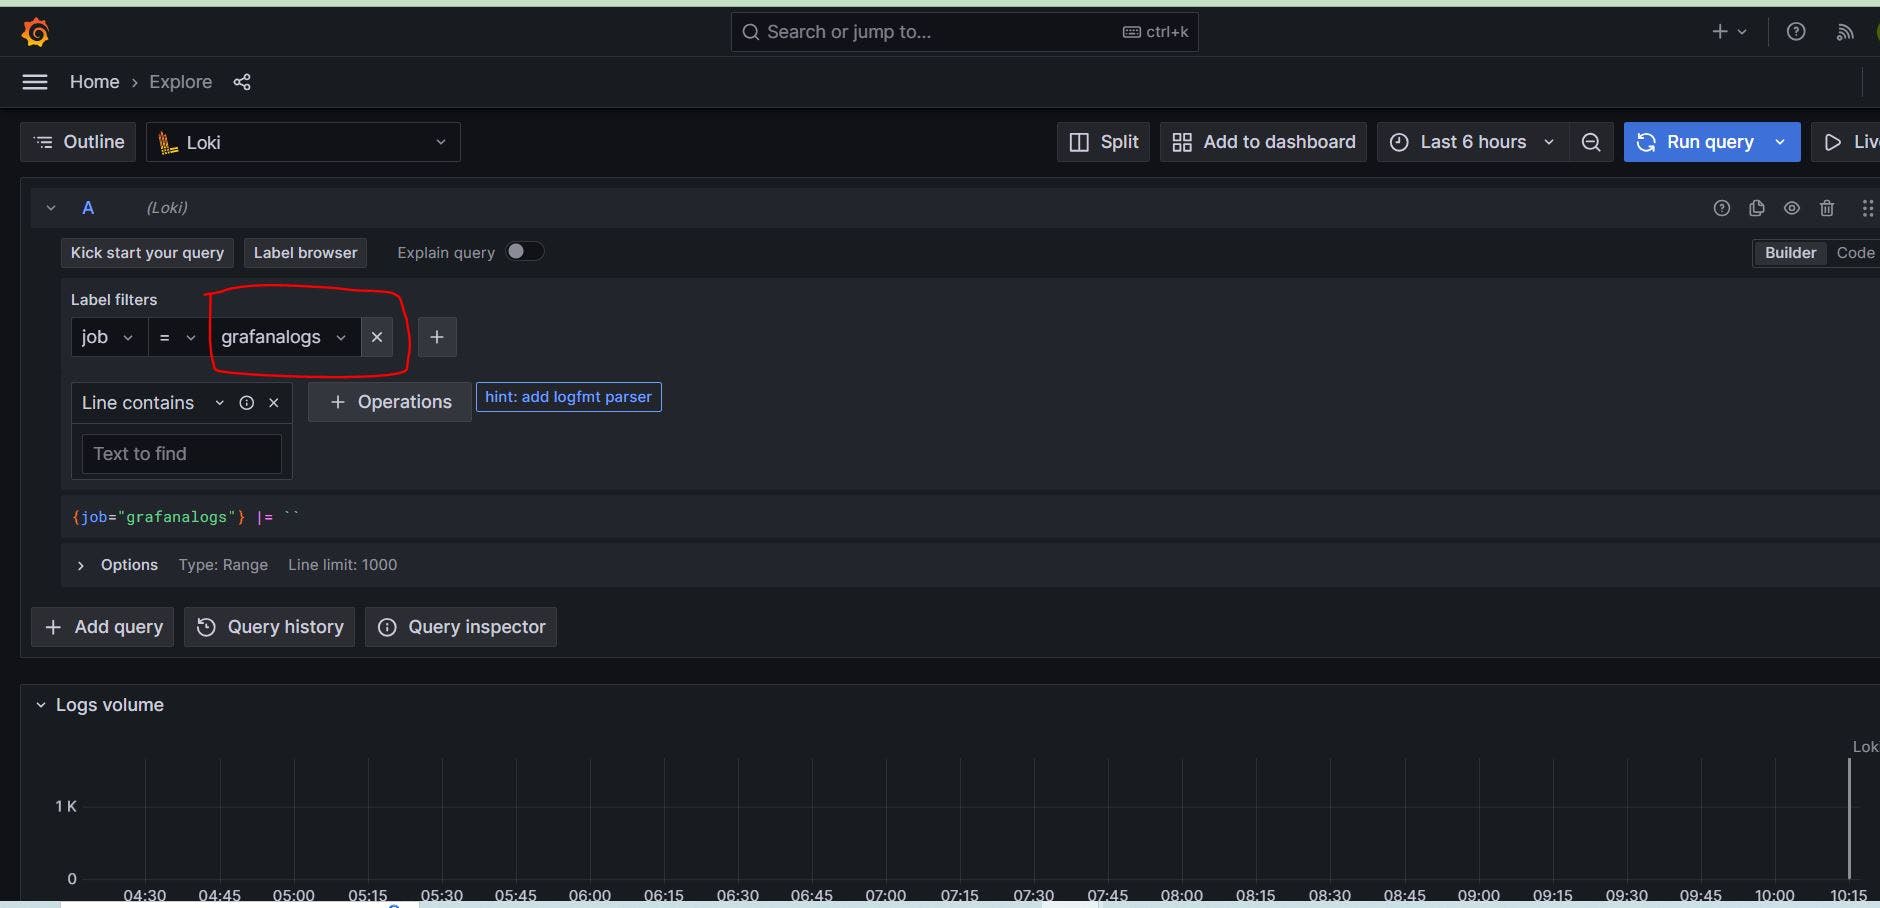
Noe Reload the Grafana dashboard, select the right job with the right name, and run the query. Then you will see all of the logs from Grafana appearing.
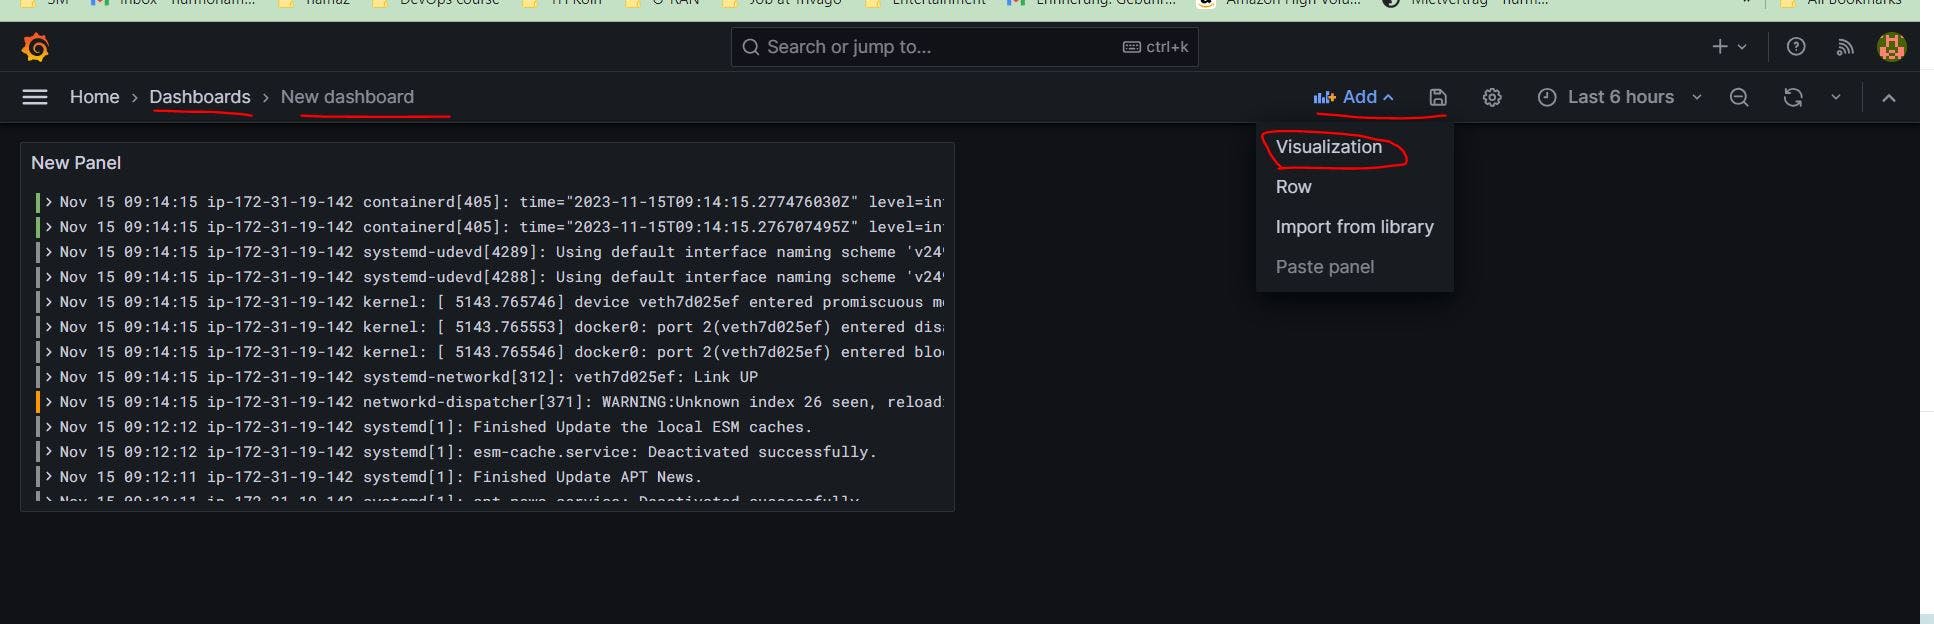
Now add these logs to a dashboard. Click the Add Dashboard option and select Open Dashboard. Now go to the top right corner, where you can add visualization, rows, and libraries. Click visualization.
Once we click here, we will see there is no data. For this, first install something on your system. In this, we install nginx.
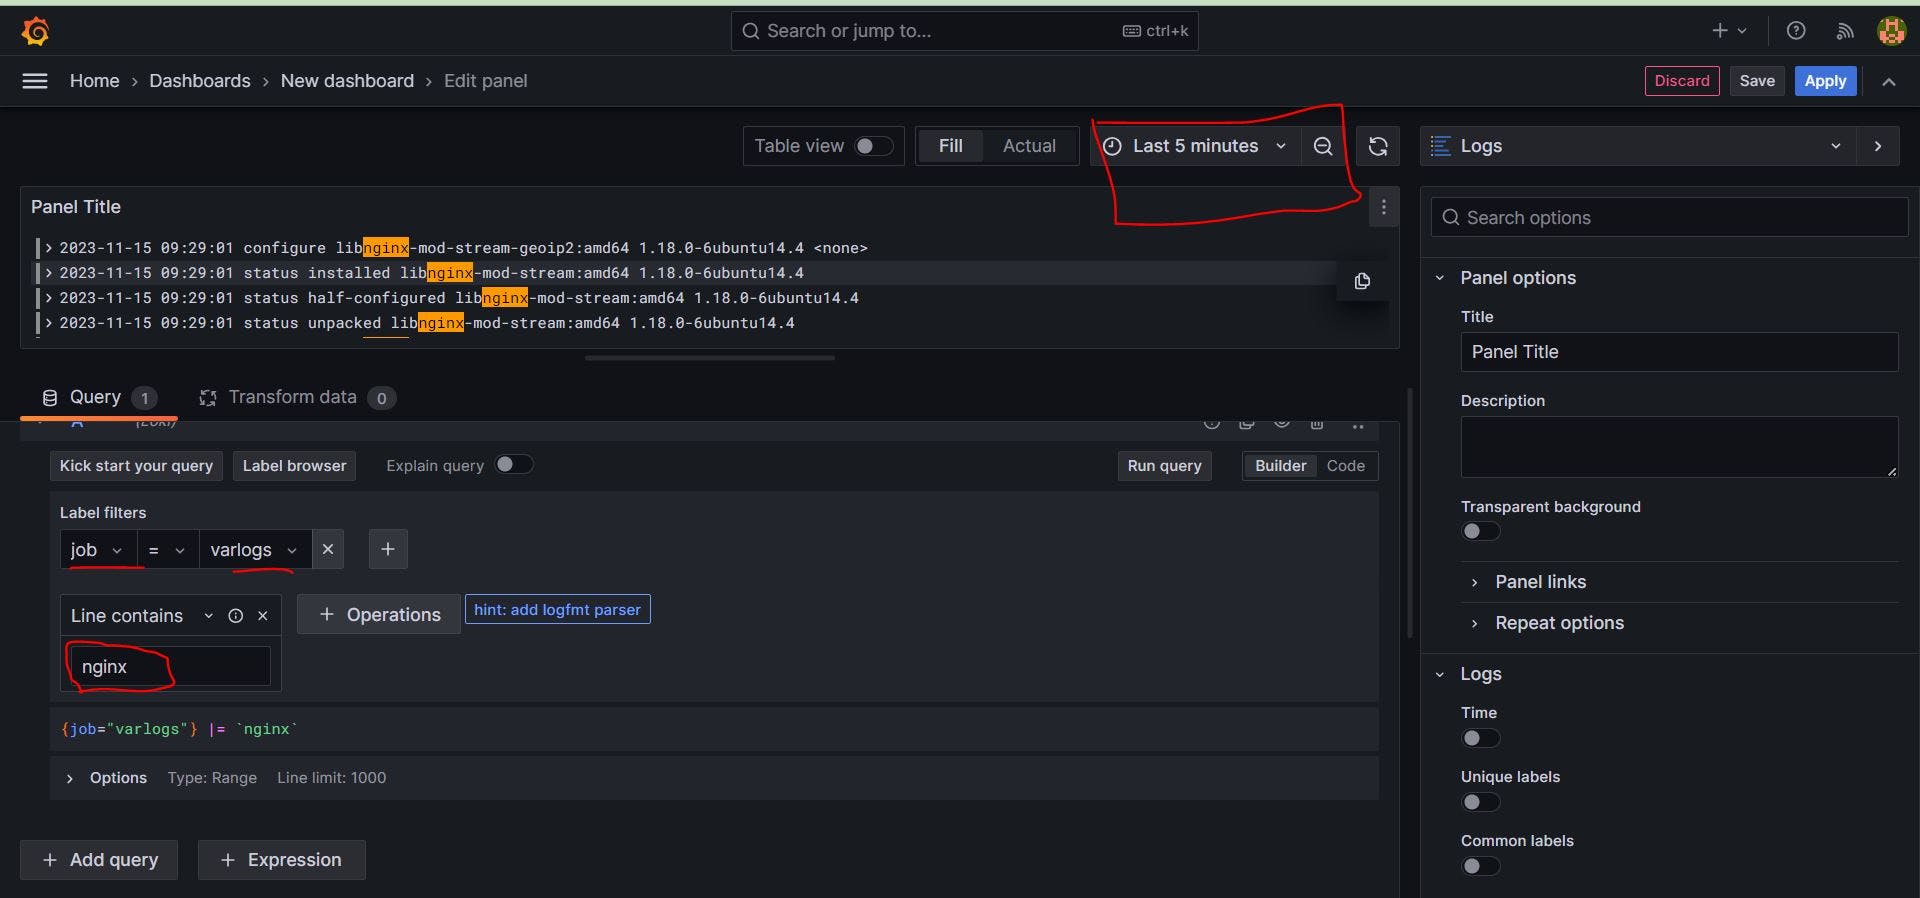
Now select rate to see how many times nginx are counting into our logs.
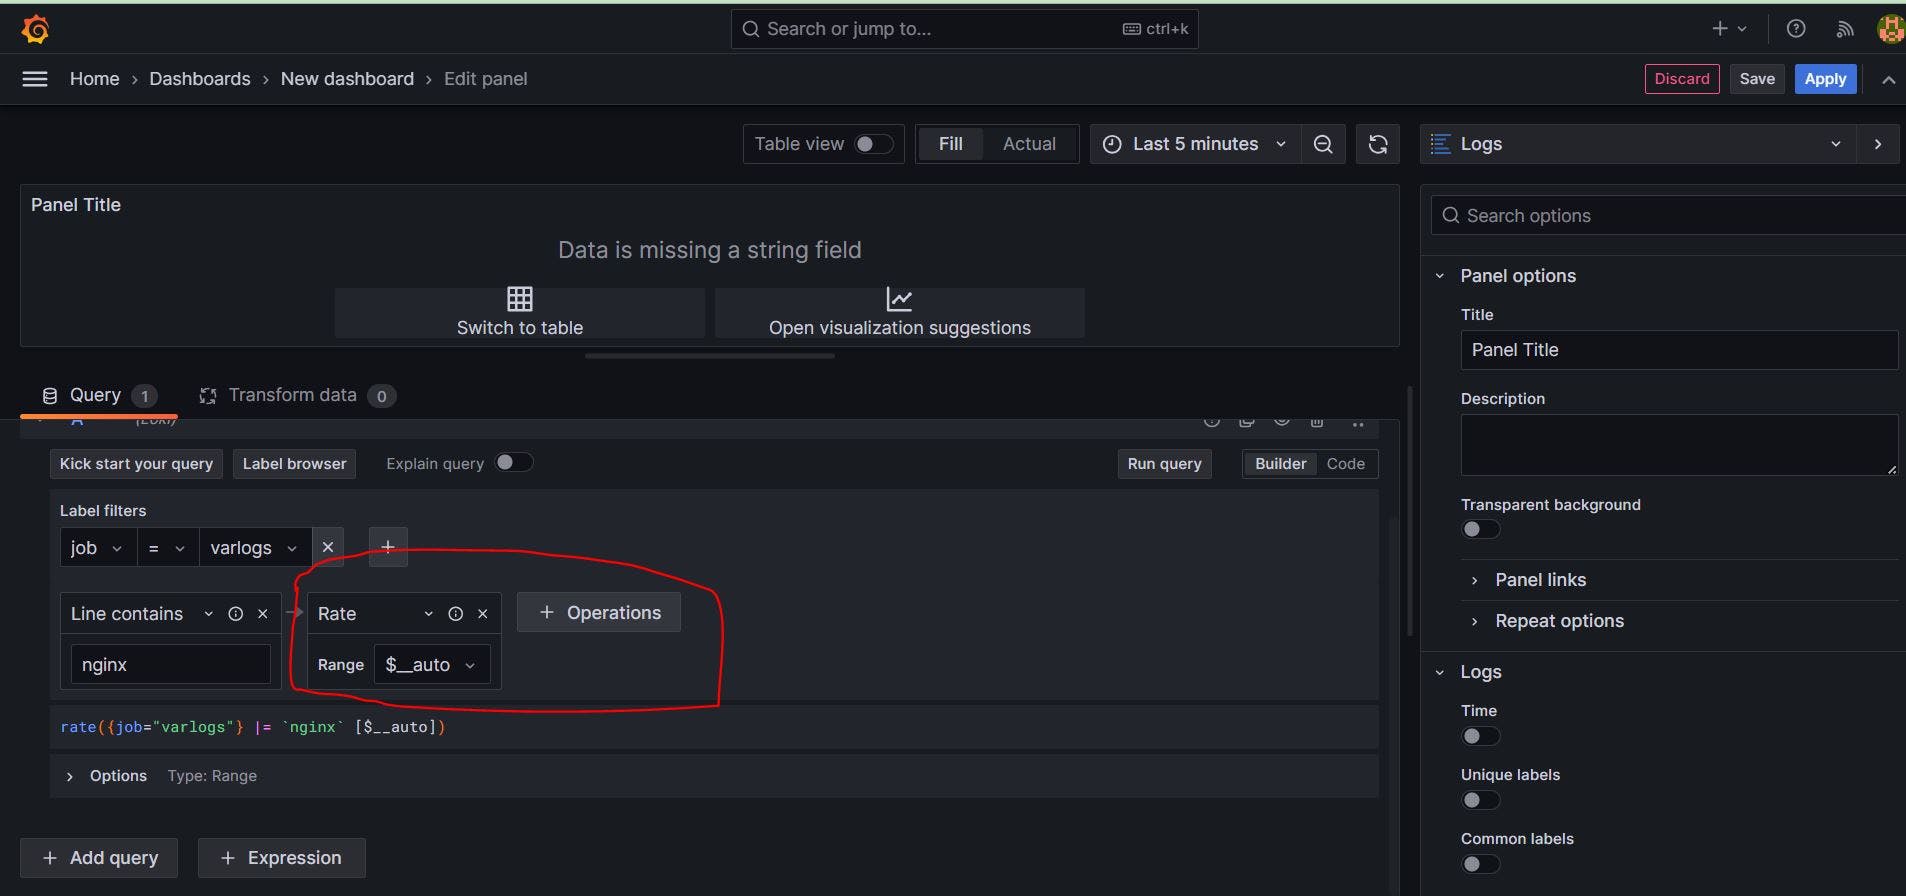
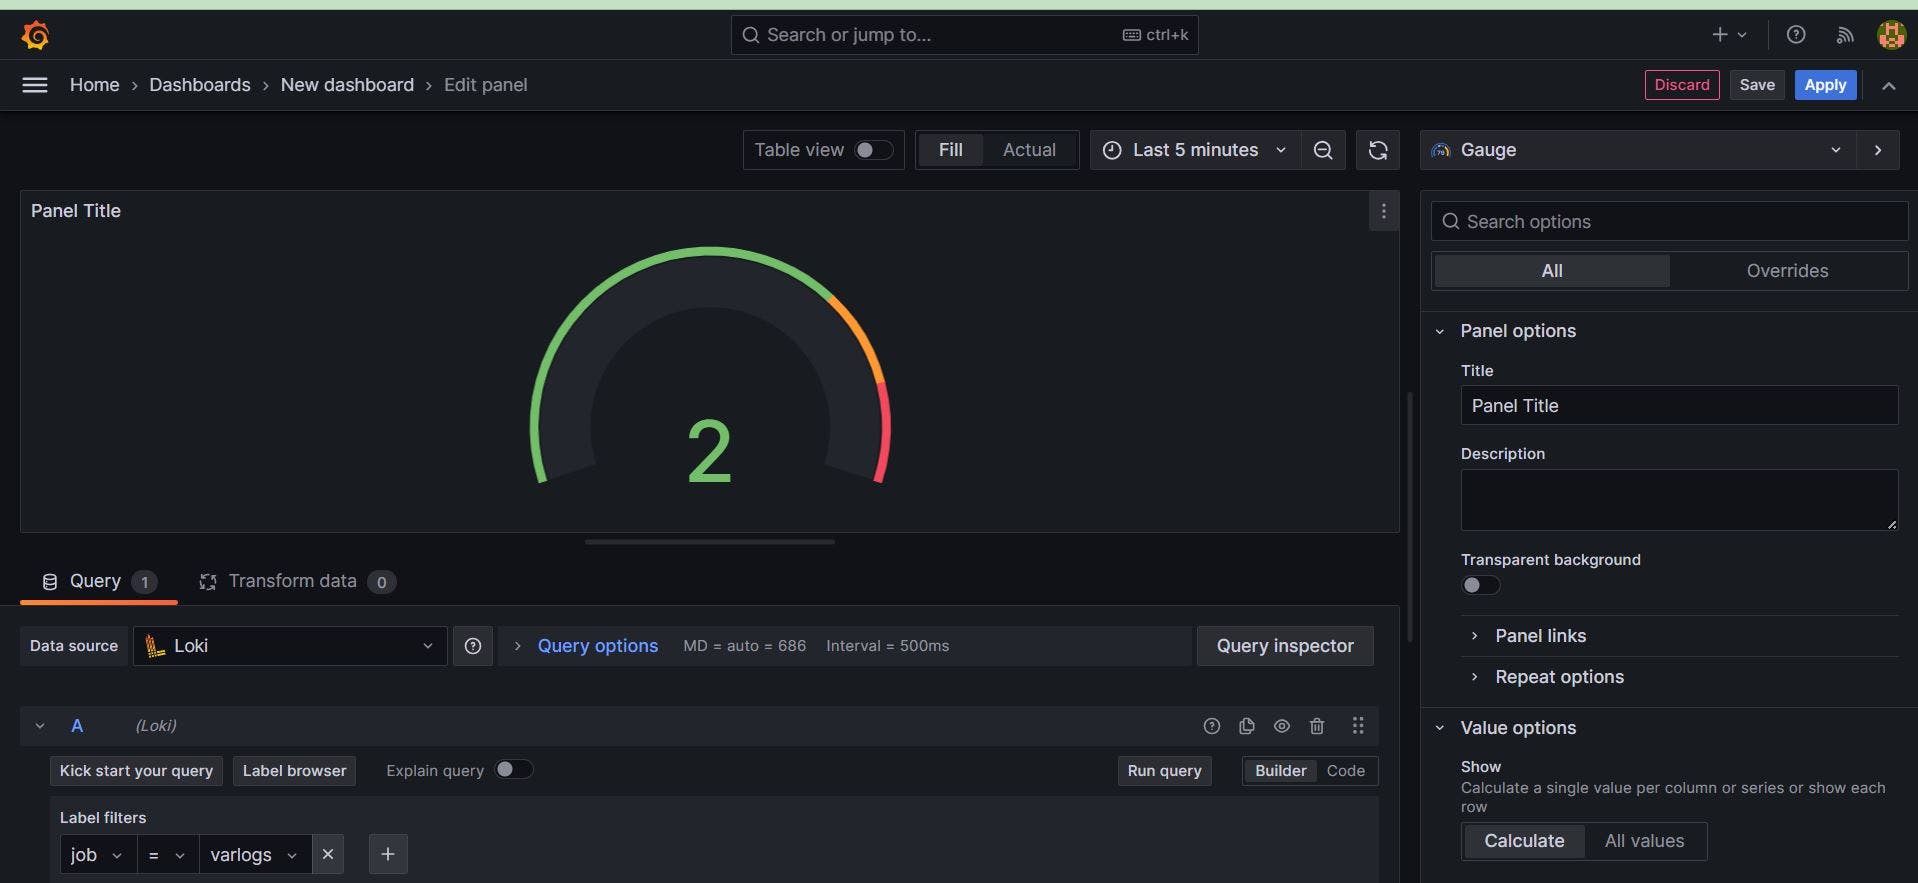
Now you are able to see all dashboards with different styles.